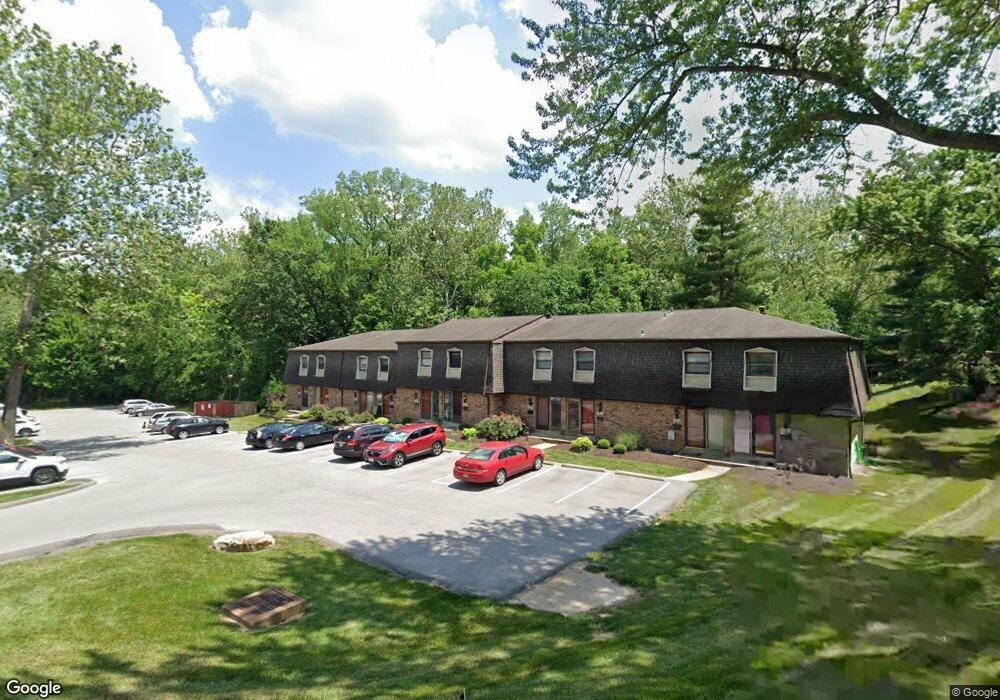
1220 Wicklow Rd Unit G Ballwin, MO 63021
Estimated Value: $167,000 - $171,719
2
Beds
2
Baths
1,140
Sq Ft
$148/Sq Ft
Est. Value
About This Home
This home is located at 1220 Wicklow Rd Unit G, Ballwin, MO 63021 and is currently estimated at $169,180, approximately $148 per square foot. 1220 Wicklow Rd Unit G is a home located in St. Louis County with nearby schools including Carman Trails Elementary School, Parkway South Middle School, and Parkway South High School.
Ownership History
Date
Name
Owned For
Owner Type
Purchase Details
Closed on
Jan 23, 2007
Sold by
Allen Patricia L and Kruming Patricia L
Bought by
Patricia L Allen Living Trust
Current Estimated Value
Purchase Details
Closed on
Jun 14, 2004
Sold by
Littleton Randall and Littleton Emily J
Bought by
Kruming Patricia L
Home Financials for this Owner
Home Financials are based on the most recent Mortgage that was taken out on this home.
Original Mortgage
$72,100
Outstanding Balance
$35,999
Interest Rate
6.32%
Mortgage Type
Purchase Money Mortgage
Estimated Equity
$133,181
Purchase Details
Closed on
Aug 28, 2003
Sold by
Rellergent Cheryl and Rellergent Jerome
Bought by
Littleton Randall and Littleton Emily J
Home Financials for this Owner
Home Financials are based on the most recent Mortgage that was taken out on this home.
Original Mortgage
$114,450
Interest Rate
5.87%
Mortgage Type
Purchase Money Mortgage
Create a Home Valuation Report for This Property
The Home Valuation Report is an in-depth analysis detailing your home's value as well as a comparison with similar homes in the area
Home Values in the Area
Average Home Value in this Area
Purchase History
| Date | Buyer | Sale Price | Title Company |
|---|---|---|---|
| Patricia L Allen Living Trust | -- | None Available | |
| Kruming Patricia L | $125,100 | -- | |
| Littleton Randall | $118,000 | -- |
Source: Public Records
Mortgage History
| Date | Status | Borrower | Loan Amount |
|---|---|---|---|
| Open | Kruming Patricia L | $72,100 | |
| Previous Owner | Littleton Randall | $114,450 |
Source: Public Records
Tax History
| Year | Tax Paid | Tax Assessment Tax Assessment Total Assessment is a certain percentage of the fair market value that is determined by local assessors to be the total taxable value of land and additions on the property. | Land | Improvement |
|---|---|---|---|---|
| 2025 | $1,747 | $29,120 | $8,660 | $20,460 |
| 2024 | $1,747 | $27,060 | $5,970 | $21,090 |
| 2023 | $1,763 | $27,060 | $5,970 | $21,090 |
| 2022 | $1,691 | $23,790 | $7,790 | $16,000 |
| 2021 | $1,681 | $23,790 | $7,790 | $16,000 |
| 2020 | $1,616 | $21,870 | $7,140 | $14,730 |
| 2019 | $1,597 | $21,870 | $7,140 | $14,730 |
| 2018 | $1,551 | $19,650 | $3,900 | $15,750 |
| 2017 | $1,533 | $19,650 | $3,900 | $15,750 |
| 2016 | $1,194 | $14,520 | $3,460 | $11,060 |
Source: Public Records
Map
Nearby Homes
- 1220 Wicklow Rd Unit J
- 256 Glandore Dr Unit D
- 221 Braeshire Dr Unit B
- 308 Forest Parkway Dr
- 9 Lochhaven Ln
- 514 Meramec Station Rd
- 1039 Treeline Ct
- 1016 Howard George Dr
- 952 Queensbridge Rd
- 747 La Feil Dr
- 624 Sandy Oak Dr
- 322 Old Meramec Station Rd
- 802 Delhurst Dr
- 0 Unknown Unit MIS25060078
- 0 Unknown Unit MIS25060104
- 0 Unknown Unit MIS25060076
- 0 Unknown Unit MIS25060105
- 0 Unknown Unit MIS25060100
- 0 Unknown Unit MIS25060079
- 0 Unknown Unit MIS25060108
- 1220 Wicklow Rd Unit E
- 1220 Wicklow Rd Unit F
- 1220 Wicklow Rd Unit B
- 1220 Wicklow Rd Unit I
- 1220 Wicklow Rd Unit D
- 1220 Wicklow Rd Unit H
- 1220 Wicklow Rd Unit C
- 2bblt Ruppel Farms
- 1210 Wicklow Rd Unit G
- 1210 Wicklow Rd Unit F
- 1210 Wicklow Rd Unit K
- 1210 Wicklow Rd Unit H
- 1210 Wicklow Rd Unit A
- 1210 Wicklow Rd Unit E
- 1210 Wicklow Rd Unit J
- 1210 Wicklow Rd Unit C
- 1210 Wicklow Rd Unit D
- 1210 Wicklow Rd Unit N
- 1210 Wicklow Rd Unit L
- 1210 Wicklow Rd Unit I
Your Personal Tour Guide
Ask me questions while you tour the home.