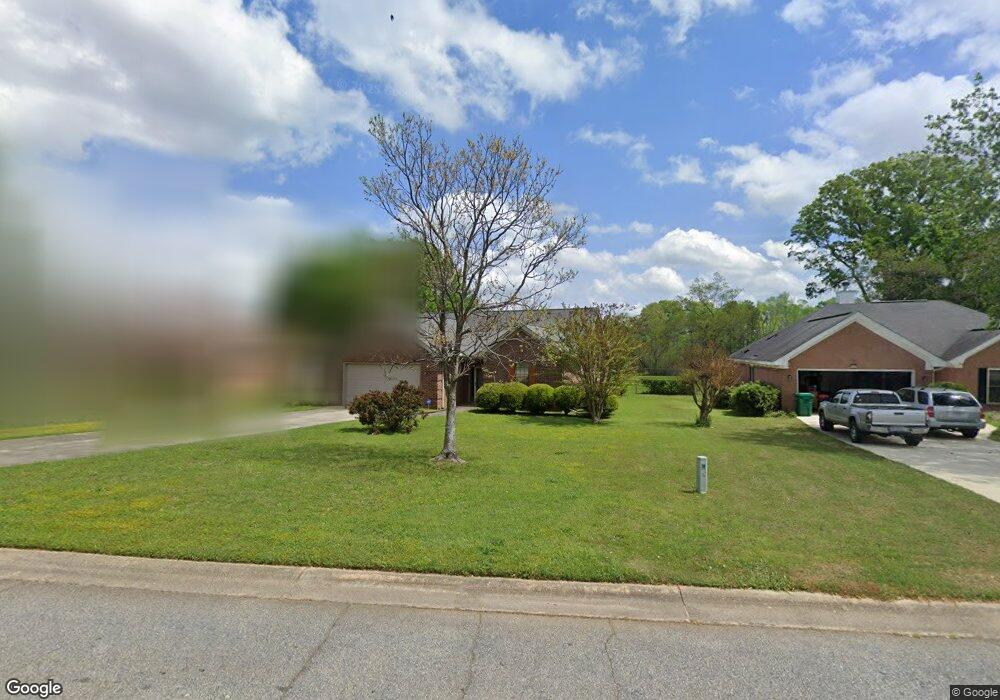
1220 Willow Bend Warner Robins, GA 31088
Estimated Value: $256,000 - $264,000
3
Beds
2
Baths
1,733
Sq Ft
$149/Sq Ft
Est. Value
About This Home
This home is located at 1220 Willow Bend, Warner Robins, GA 31088 and is currently estimated at $258,295, approximately $149 per square foot. 1220 Willow Bend is a home located in Houston County with nearby schools including David A. Perdue Primary School, David A. Perdue Elementary School, and Feagin Mill Middle School.
Ownership History
Date
Name
Owned For
Owner Type
Purchase Details
Closed on
Mar 29, 2010
Sold by
Wallace Trevor M and Wallace Lisa M
Bought by
Jordan Barbara L
Current Estimated Value
Home Financials for this Owner
Home Financials are based on the most recent Mortgage that was taken out on this home.
Original Mortgage
$151,642
Outstanding Balance
$98,716
Interest Rate
5.02%
Mortgage Type
FHA
Estimated Equity
$159,579
Purchase Details
Closed on
Nov 29, 2004
Sold by
Wallace Trevor M and Wallace Lisa M
Bought by
Wallace Trevor M
Purchase Details
Closed on
Aug 28, 1997
Sold by
Redlinger Ronald J
Bought by
Nowak John R and Nowak Susan M
Purchase Details
Closed on
May 7, 1993
Sold by
Pamperien Roka D
Bought by
Redlinger Ronald J
Purchase Details
Closed on
Oct 9, 1992
Sold by
Sweetwater Development Inc
Bought by
Pamperien Roka D
Purchase Details
Closed on
Jan 7, 1992
Sold by
Greer Kenneth E and Greer Ann C
Bought by
Sweetwater Development Inc
Create a Home Valuation Report for This Property
The Home Valuation Report is an in-depth analysis detailing your home's value as well as a comparison with similar homes in the area
Home Values in the Area
Average Home Value in this Area
Purchase History
| Date | Buyer | Sale Price | Title Company |
|---|---|---|---|
| Jordan Barbara L | $135,000 | None Available | |
| Wallace Trevor M | -- | -- | |
| Wallace Trevor M | $133,900 | -- | |
| Nowak John R | $107,500 | -- | |
| Redlinger Ronald J | $91,900 | -- | |
| Pamperien Roka D | $11,500 | -- | |
| Sweetwater Development Inc | -- | -- |
Source: Public Records
Mortgage History
| Date | Status | Borrower | Loan Amount |
|---|---|---|---|
| Open | Jordan Barbara L | $151,642 |
Source: Public Records
Tax History
| Year | Tax Paid | Tax Assessment Tax Assessment Total Assessment is a certain percentage of the fair market value that is determined by local assessors to be the total taxable value of land and additions on the property. | Land | Improvement |
|---|---|---|---|---|
| 2025 | $1,867 | $85,480 | $10,000 | $75,480 |
| 2024 | $1,727 | $81,280 | $10,000 | $71,280 |
| 2023 | $1,577 | $74,320 | $10,000 | $64,320 |
| 2022 | $1,327 | $64,000 | $8,800 | $55,200 |
| 2021 | $1,155 | $56,640 | $8,800 | $47,840 |
| 2020 | $974 | $49,000 | $8,800 | $40,200 |
| 2019 | $974 | $49,000 | $8,800 | $40,200 |
| 2018 | $974 | $49,000 | $8,800 | $40,200 |
| 2017 | $1,197 | $49,000 | $8,800 | $40,200 |
| 2016 | $1,199 | $49,000 | $8,800 | $40,200 |
| 2015 | $1,201 | $49,000 | $8,800 | $40,200 |
| 2014 | -- | $49,000 | $8,800 | $40,200 |
| 2013 | -- | $52,560 | $8,800 | $43,760 |
Source: Public Records
Map
Nearby Homes
- 112 Ballyhara
- 213 Air Park Dr
- 208 Twelve Oaks Dr
- 301 Meyers Lake Dr
- 404 Minter Dr
- 504 Haverhill Cir
- 401 Bella Notte Cir Unit 5D
- 401 Bella Notte Cir
- 414 Bella Notte Cir
- 414 Bella Notte Cir Unit 23A
- 409 Bella Notte Cir Unit 1D
- 409 Bella Notte Cir
- 316 Haverhill Cir
- 207 Broderick Cir
- 611 Broderick Cir
- 629 Broderick Cir
- 500 Bella Notte Cir Unit 16A
- 500 Bella Notte Cir
- 108 Holbeck Ct
- 502 Bella Notte Cir
- 1222 Willow Bend
- 1218 Willow Bend
- 1224 Willow Bend
- 1216 Willow Bend
- 1221 Willow Bend
- 1223 Willow Bend
- 1102 Thornblade Dr
- 1100 Thornblade Dr
- 1219 Willow Bend
- 1225 Willow Bend
- 1217 Willow Bend
- 1106 Thornblade Dr
- 1212 Willow Bend
- 1227 Willow Bend
- 1215 Willow Bend
- 1108 Thornblade Dr
- 1229 Willow Bend
- 110 Fontaine Walk
- 1210 Willow Bend
- 1213 Willow Bend
Your Personal Tour Guide
Ask me questions while you tour the home.