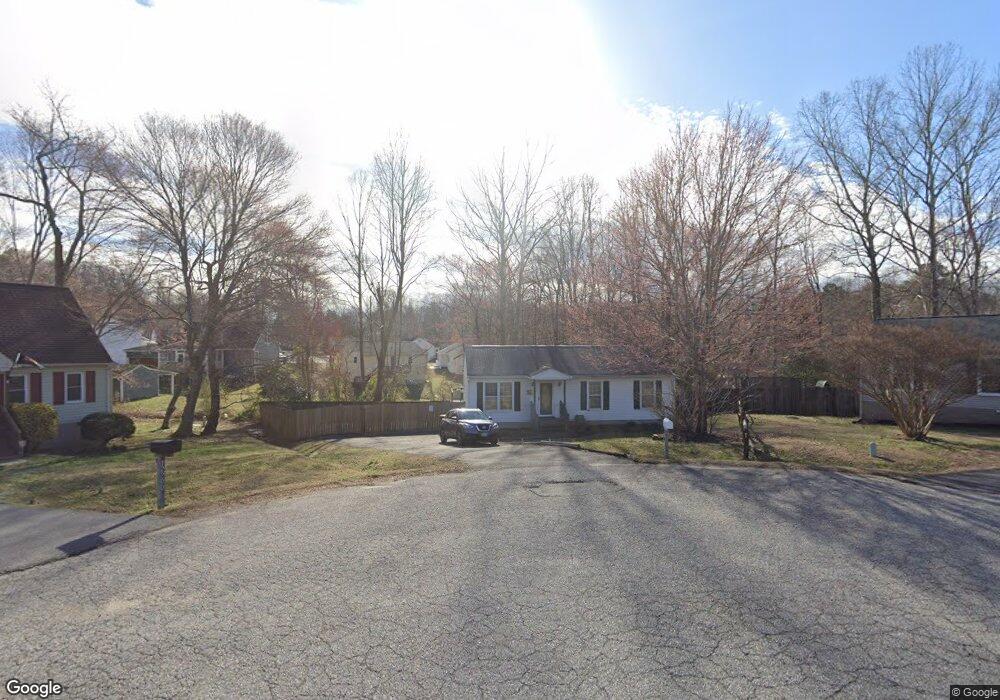
12201 Gable Way Midlothian, VA 23112
Estimated Value: $262,000 - $282,000
3
Beds
2
Baths
972
Sq Ft
$284/Sq Ft
Est. Value
About This Home
This home is located at 12201 Gable Way, Midlothian, VA 23112 and is currently estimated at $276,319, approximately $284 per square foot. 12201 Gable Way is a home located in Chesterfield County with nearby schools including Thelma Crenshaw Elementary School, Bailey Bridge Middle School, and Manchester High.
Ownership History
Date
Name
Owned For
Owner Type
Purchase Details
Closed on
Feb 16, 2009
Sold by
Hsbc Bank Usa N A As Trus
Bought by
Russbycraig Llc
Current Estimated Value
Purchase Details
Closed on
Dec 31, 2008
Sold by
Professional Foreclosure
Bought by
Hsbc Bank Usa N A As Trustee
Purchase Details
Closed on
Jun 14, 2005
Sold by
Fleming Brian Andrew
Bought by
Crawley Sherhonda L
Home Financials for this Owner
Home Financials are based on the most recent Mortgage that was taken out on this home.
Original Mortgage
$110,400
Interest Rate
5.78%
Mortgage Type
New Conventional
Purchase Details
Closed on
Feb 24, 1997
Sold by
Mcclaugherty Patrick C
Bought by
Fleming Brian A
Home Financials for this Owner
Home Financials are based on the most recent Mortgage that was taken out on this home.
Original Mortgage
$74,248
Interest Rate
7.8%
Mortgage Type
FHA
Create a Home Valuation Report for This Property
The Home Valuation Report is an in-depth analysis detailing your home's value as well as a comparison with similar homes in the area
Home Values in the Area
Average Home Value in this Area
Purchase History
| Date | Buyer | Sale Price | Title Company |
|---|---|---|---|
| Russbycraig Llc | $105,500 | -- | |
| Hsbc Bank Usa N A As Trustee | $120,435 | -- | |
| Crawley Sherhonda L | $138,000 | -- | |
| Fleming Brian A | $75,000 | -- |
Source: Public Records
Mortgage History
| Date | Status | Borrower | Loan Amount |
|---|---|---|---|
| Previous Owner | Crawley Sherhonda L | $110,400 | |
| Previous Owner | Fleming Brian A | $74,248 |
Source: Public Records
Tax History Compared to Growth
Tax History
| Year | Tax Paid | Tax Assessment Tax Assessment Total Assessment is a certain percentage of the fair market value that is determined by local assessors to be the total taxable value of land and additions on the property. | Land | Improvement |
|---|---|---|---|---|
| 2025 | $2,131 | $236,600 | $55,000 | $181,600 |
| 2024 | $2,131 | $231,100 | $51,000 | $180,100 |
| 2023 | $1,935 | $212,600 | $49,000 | $163,600 |
| 2022 | $1,780 | $193,500 | $47,000 | $146,500 |
| 2021 | $1,652 | $171,300 | $45,000 | $126,300 |
| 2020 | $1,504 | $158,300 | $43,000 | $115,300 |
| 2019 | $1,384 | $145,700 | $41,000 | $104,700 |
| 2018 | $1,319 | $138,800 | $40,000 | $98,800 |
| 2017 | $1,195 | $124,500 | $38,000 | $86,500 |
| 2016 | $1,145 | $119,300 | $38,000 | $81,300 |
| 2015 | $1,158 | $120,600 | $38,000 | $82,600 |
| 2014 | $1,104 | $115,000 | $35,500 | $79,500 |
Source: Public Records
Map
Nearby Homes
- 5112 Twelveoaks Rd
- 5500 Creek Crossing Dr
- 12219 Old Bailey Bridge Rd
- 4524 Glen Tara Dr
- 5000 Misty Spring Dr
- 12104 Southernbelle Ct
- 4122 Ebbies Crossing
- 4118 Ebbies Crossing
- 4116 Ebbies Crossing
- 4114 Ebbies Crossing
- 4112 Ebbies Crossing
- 12445 Wescott Ave
- 5019 Misty Spring Dr
- 4000 Maze Runner Dr Unit 103
- 3900 Maze Runner Dr Unit 206
- 3800 Maze Runner Dr Unit 202
- 3900 Maze Runner Dr Unit 205
- 3700 Maze Runner Dr Unit 405
- 4009 Next Level Trace
- 4007 Next Level Trace
- 12203 Gable Way
- 12113 Timbernorth Ct
- 12112 Timbernorth Ct
- 12200 Gable Way
- 12205 Gable Way
- 12112 Timber Trail Dr
- 12118 Timber Trail Dr
- 12106 Timber Trail Dr
- 12124 Timber Trail Dr
- 12100 Timber Trail Dr
- 12204 Gable Way
- 12106 Timbernorth Ct
- 12130 Timber Trail Dr
- 12207 Gable Way
- 12108 Timbernorth Ct
- 12018 Timber Trail Dr
- 12101 Timbernorth Ct
- 12206 Gable Way
- 12200 Timber Trail Dr
- 12100 Timbernorth Ct