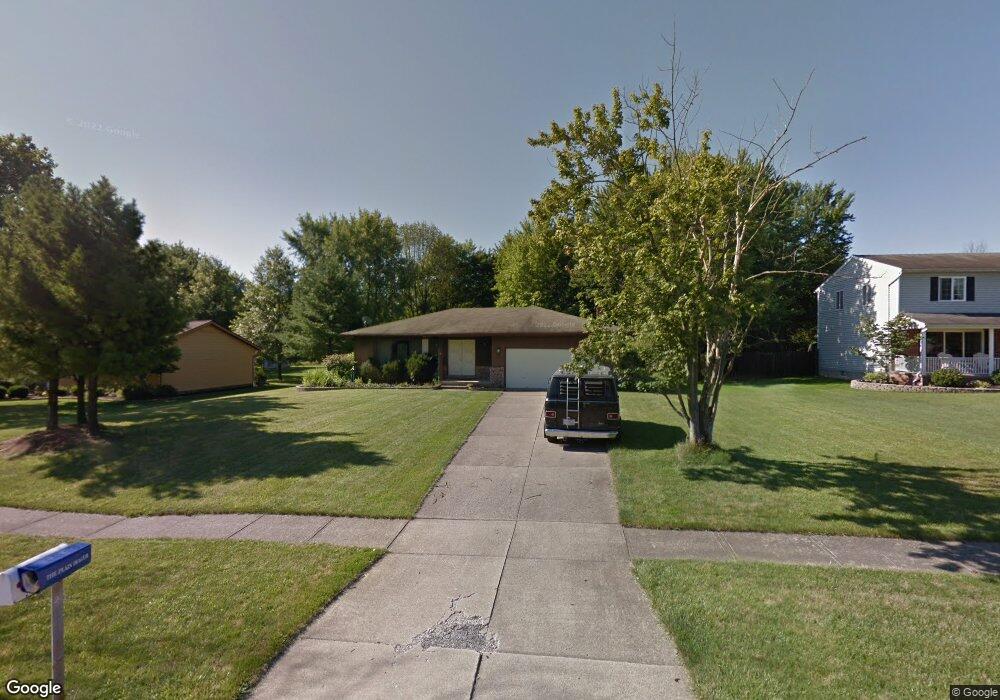
12201 Woodridge Dr North Royalton, OH 44133
Estimated Value: $309,271 - $332,000
3
Beds
2
Baths
1,746
Sq Ft
$185/Sq Ft
Est. Value
About This Home
This home is located at 12201 Woodridge Dr, North Royalton, OH 44133 and is currently estimated at $322,818, approximately $184 per square foot. 12201 Woodridge Dr is a home located in Cuyahoga County with nearby schools including North Royalton Middle School, North Royalton High School, and Royal Redeemer Lutheran School.
Ownership History
Date
Name
Owned For
Owner Type
Purchase Details
Closed on
Apr 3, 2014
Sold by
Lizak Lola A Mccraw
Bought by
Webber Christoher J and Webber Heidi M
Current Estimated Value
Purchase Details
Closed on
May 27, 2005
Sold by
Pilny Dennis M and Pilny Barbara A
Bought by
Lizak Robert G and Mccraw Lizak Lola A
Home Financials for this Owner
Home Financials are based on the most recent Mortgage that was taken out on this home.
Original Mortgage
$146,800
Interest Rate
6.07%
Mortgage Type
Fannie Mae Freddie Mac
Purchase Details
Closed on
May 13, 1986
Sold by
Kasparek Mariann
Bought by
Pilny Dennis M
Purchase Details
Closed on
Oct 30, 1978
Bought by
Kasparek Mariann
Purchase Details
Closed on
Mar 8, 1978
Bought by
Flair Corp
Purchase Details
Closed on
Jan 1, 1978
Bought by
Cap Inc
Create a Home Valuation Report for This Property
The Home Valuation Report is an in-depth analysis detailing your home's value as well as a comparison with similar homes in the area
Home Values in the Area
Average Home Value in this Area
Purchase History
| Date | Buyer | Sale Price | Title Company |
|---|---|---|---|
| Webber Christoher J | $105,000 | None Available | |
| Lizak Robert G | $183,500 | City Title Agency | |
| Pilny Dennis M | $90,500 | -- | |
| Kasparek Mariann | $80,100 | -- | |
| Flair Corp | -- | -- | |
| Cap Inc | -- | -- |
Source: Public Records
Mortgage History
| Date | Status | Borrower | Loan Amount |
|---|---|---|---|
| Previous Owner | Lizak Robert G | $146,800 | |
| Closed | Lizak Robert G | $27,525 |
Source: Public Records
Tax History Compared to Growth
Tax History
| Year | Tax Paid | Tax Assessment Tax Assessment Total Assessment is a certain percentage of the fair market value that is determined by local assessors to be the total taxable value of land and additions on the property. | Land | Improvement |
|---|---|---|---|---|
| 2024 | $4,676 | $80,500 | $17,990 | $62,510 |
| 2023 | $4,968 | $78,440 | $15,860 | $62,580 |
| 2022 | $4,934 | $78,440 | $15,860 | $62,580 |
| 2021 | $4,986 | $78,440 | $15,860 | $62,580 |
| 2020 | $4,746 | $69,410 | $14,040 | $55,370 |
| 2019 | $4,611 | $198,300 | $40,100 | $158,200 |
| 2018 | $4,664 | $69,410 | $14,040 | $55,370 |
| 2017 | $4,228 | $60,100 | $15,860 | $44,240 |
| 2016 | $3,970 | $60,100 | $15,860 | $44,240 |
| 2015 | $3,332 | $60,100 | $15,860 | $44,240 |
| 2014 | $3,332 | $60,100 | $15,860 | $44,240 |
Source: Public Records
Map
Nearby Homes
- 11806 Harbour Light Dr Unit 1806
- 10700 Abbey Rd
- 11650 Harbour Light Dr Unit 1650
- 11445 Harbour Light Dr
- 9938 Abbey Rd
- 13402 Bridgecreek Cir
- 12664 W 130th St
- 10560 Independence Dr Unit 25A
- 9821 Sunrise Blvd Unit o1
- 9800 Cove Dr Unit H2
- 9761 Sunrise Blvd
- 10364 Independence Dr Unit 19c
- 10641 Albion Rd
- 10342 Independence Dr Unit 21B
- 9710 Cove Dr Unit 23G
- 14644 Baywood Ln
- 14584 Baywood Ln
- 14557 Baywood Ln
- 9660 Cove Dr Unit F13
- 9630 Cove Dr Unit A-14
- 12161 Woodridge Dr
- 12121 Woodridge Dr
- 12281 Woodridge Dr
- 12150 Wood Oval
- 12200 Woodridge Dr
- 12160 Woodridge Dr
- 12081 Woodridge Dr
- 12240 Woodridge Dr
- 12136 Wood Oval
- 12280 Woodridge Dr
- 12361 Woodridge Dr
- 12122 Wood Oval
- 12320 Woodridge Dr
- 12401 Woodridge Dr
- 11167 Shawnee Cir
- 12001 Woodridge Dr
- 12108 Wood Oval
- 12360 Woodridge Dr
- 11127 Shawnee Cir
- 12000 Wood Oval