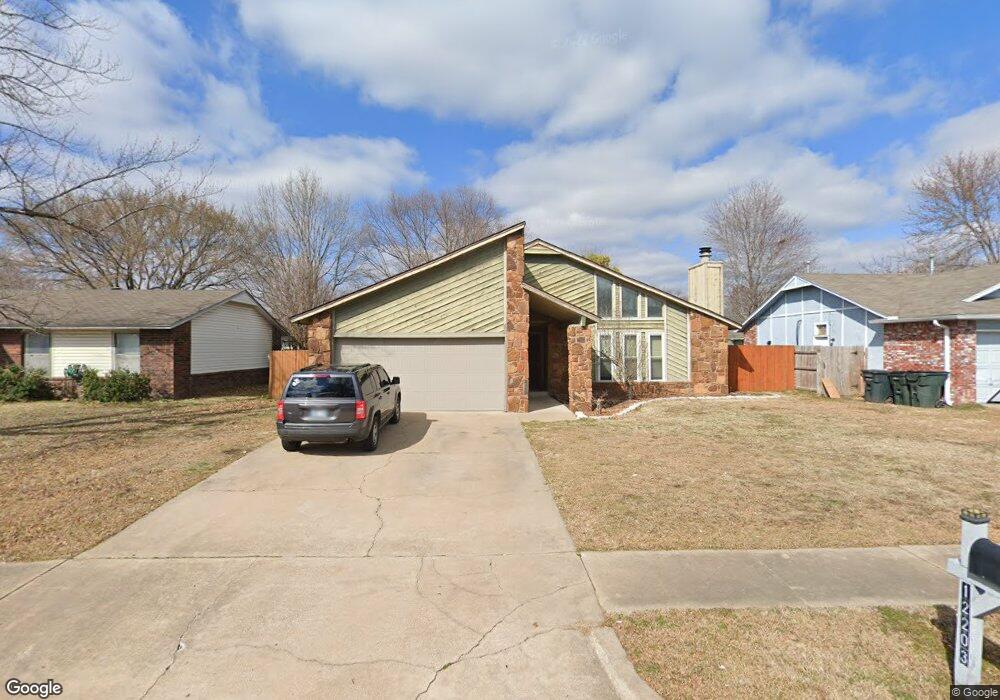
12203 E 81st Place N Owasso, OK 74055
Estimated Value: $200,000 - $224,000
--
Bed
2
Baths
1,294
Sq Ft
$164/Sq Ft
Est. Value
About This Home
This home is located at 12203 E 81st Place N, Owasso, OK 74055 and is currently estimated at $211,668, approximately $163 per square foot. 12203 E 81st Place N is a home located in Tulsa County with nearby schools including Mills Elementary School, Owasso 6th Grade Center, and Owasso 8th Grade Center.
Ownership History
Date
Name
Owned For
Owner Type
Purchase Details
Closed on
Oct 4, 2007
Sold by
Manter Eugene B and Manter Marcia E
Bought by
Kemp Joseph James and Kemp Stacey Annette
Current Estimated Value
Home Financials for this Owner
Home Financials are based on the most recent Mortgage that was taken out on this home.
Original Mortgage
$111,343
Outstanding Balance
$70,454
Interest Rate
6.47%
Mortgage Type
VA
Estimated Equity
$141,214
Purchase Details
Closed on
Mar 8, 2007
Sold by
Coleman Chad D
Bought by
Manter Eugene B and Manter Marcia E
Home Financials for this Owner
Home Financials are based on the most recent Mortgage that was taken out on this home.
Original Mortgage
$45,000
Interest Rate
6.32%
Mortgage Type
Purchase Money Mortgage
Purchase Details
Closed on
May 23, 2003
Sold by
Jones Scott Anthony and Jones Sheila Renee
Bought by
Coleman Chad D
Home Financials for this Owner
Home Financials are based on the most recent Mortgage that was taken out on this home.
Original Mortgage
$95,275
Interest Rate
5.79%
Mortgage Type
Purchase Money Mortgage
Create a Home Valuation Report for This Property
The Home Valuation Report is an in-depth analysis detailing your home's value as well as a comparison with similar homes in the area
Home Values in the Area
Average Home Value in this Area
Purchase History
| Date | Buyer | Sale Price | Title Company |
|---|---|---|---|
| Kemp Joseph James | $109,000 | First American Title & Abstr | |
| Manter Eugene B | $109,000 | Firstitle & Abstract Service | |
| Coleman Chad D | $92,500 | Firstitle & Abstract Svcs In |
Source: Public Records
Mortgage History
| Date | Status | Borrower | Loan Amount |
|---|---|---|---|
| Open | Kemp Joseph James | $111,343 | |
| Previous Owner | Manter Eugene B | $45,000 | |
| Previous Owner | Coleman Chad D | $95,275 |
Source: Public Records
Tax History Compared to Growth
Tax History
| Year | Tax Paid | Tax Assessment Tax Assessment Total Assessment is a certain percentage of the fair market value that is determined by local assessors to be the total taxable value of land and additions on the property. | Land | Improvement |
|---|---|---|---|---|
| 2024 | $1,490 | $14,375 | $1,672 | $12,703 |
| 2023 | $1,490 | $13,690 | $1,621 | $12,069 |
| 2022 | $1,482 | $13,038 | $2,091 | $10,947 |
| 2021 | $1,397 | $12,417 | $2,420 | $9,997 |
| 2020 | $1,397 | $12,417 | $2,420 | $9,997 |
| 2019 | $1,391 | $12,417 | $2,420 | $9,997 |
| 2018 | $1,347 | $12,417 | $2,420 | $9,997 |
| 2017 | $1,352 | $12,417 | $2,420 | $9,997 |
| 2016 | $1,357 | $12,417 | $2,420 | $9,997 |
| 2015 | $1,367 | $12,417 | $2,420 | $9,997 |
| 2014 | $1,379 | $12,417 | $2,420 | $9,997 |
Source: Public Records
Map
Nearby Homes
- 12207 E 82nd Place N
- 8102 N 121st East Ave
- 8214 N 122nd East Ave
- 8304 N 124th Ave E
- 12700 E 82nd St N
- 11805 E 80th St N
- 8225 N 117th East Ave
- 7902 N 125th East Ave
- 8001 N 128th East Ave
- 8245 N 117th Ave E
- 12105 E 76th Place N
- 7607 N 122nd East Ave
- 13111 E 80th St N
- 13109 E 79th Ct N
- 11607 E 84th Place N
- 7602 N 127th East Ave
- 13026 E 77th Ct N
- 8708 N 124th East Ave
- 8696 N 125th East Ave
- 9930 N Garnett
- 12205 E 81st Place N
- 12201 E 81st Place N
- 12204 E 82nd St N
- 12207 E 81st Place N
- 12206 E 82nd St N
- 12202 E 82nd St N
- 12204 E 81st Place N
- 12202 E 81st Place N
- 12206 E 81st Place N
- 12209 E 81st Place N
- 12208 E 82nd St N
- 12208 E 81st Place N
- 8106 N 122nd East Ave
- 8108 N 122nd East Ave
- 8104 N 122nd East Ave
- 8110 N 122nd East Ave
- 12211 E 81st Place N
- 12210 E 82nd St N
- 12210 E 81st Place N
- 8112 N 122nd East Ave