1221 10th St Waynesboro, VA 22980
Estimated Value: $139,000 - $150,000
3
Beds
1
Bath
728
Sq Ft
$199/Sq Ft
Est. Value
About This Home
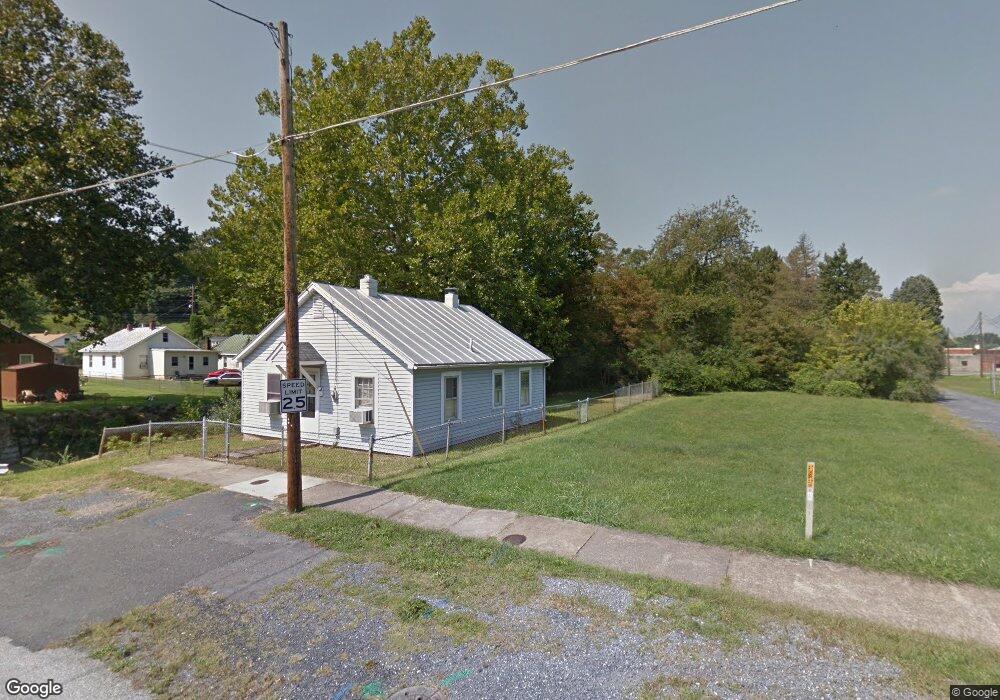
This home is located at 1221 10th St, Waynesboro, VA 22980 and is currently estimated at $144,686, approximately $198 per square foot. 1221 10th St is a home located in Waynesboro City with nearby schools including Berkeley Glenn Elementary School, Kate Collins Middle School, and Waynesboro High School.
Ownership History
Date
Name
Owned For
Owner Type
Purchase Details
Closed on
Apr 17, 2023
Sold by
Carter Roger E and Carter Gloria H
Bought by
Washington Cornell L
Current Estimated Value
Home Financials for this Owner
Home Financials are based on the most recent Mortgage that was taken out on this home.
Original Mortgage
$104,080
Outstanding Balance
$101,214
Interest Rate
6.65%
Mortgage Type
FHA
Estimated Equity
$43,472
Purchase Details
Closed on
May 5, 2008
Sold by
Cleveland Thomas E
Bought by
Carter Roger E
Create a Home Valuation Report for This Property
The Home Valuation Report is an in-depth analysis detailing your home's value as well as a comparison with similar homes in the area
Home Values in the Area
Average Home Value in this Area
Purchase History
| Date | Buyer | Sale Price | Title Company |
|---|---|---|---|
| Washington Cornell L | $106,000 | None Listed On Document | |
| Carter Roger E | $36,000 | -- |
Source: Public Records
Mortgage History
| Date | Status | Borrower | Loan Amount |
|---|---|---|---|
| Open | Washington Cornell L | $104,080 |
Source: Public Records
Tax History Compared to Growth
Tax History
| Year | Tax Paid | Tax Assessment Tax Assessment Total Assessment is a certain percentage of the fair market value that is determined by local assessors to be the total taxable value of land and additions on the property. | Land | Improvement |
|---|---|---|---|---|
| 2025 | $1,059 | $129,200 | $31,500 | $97,700 |
| 2024 | $808 | $104,900 | $30,000 | $74,900 |
| 2023 | $808 | $104,900 | $30,000 | $74,900 |
| 2022 | $617 | $68,500 | $20,000 | $48,500 |
| 2021 | $617 | $68,500 | $20,000 | $48,500 |
| 2020 | $554 | $61,600 | $20,000 | $41,600 |
| 2019 | $554 | $61,600 | $20,000 | $41,600 |
| 2018 | $485 | $53,900 | $20,000 | $33,900 |
| 2017 | $469 | $53,900 | $20,000 | $33,900 |
| 2016 | $434 | $54,200 | $20,000 | $34,200 |
| 2015 | $434 | $54,200 | $20,000 | $34,200 |
| 2014 | -- | $51,900 | $20,000 | $31,900 |
| 2013 | -- | $0 | $0 | $0 |
Source: Public Records
Map
Nearby Homes
- 1465 10th St
- 229 S Winchester Ave
- 329 S Winchester Ave
- 164 N Delphine Ave Unit 356-360-364,164-166,
- 600 E Main St
- 268 N Delphine Ave
- 1200 5th St
- 0 5th St
- 1200 5th St Unit 1200, 1204, 1208
- 317 Ivanhoe Ave
- 313 Ivanhoe Ave
- 309 Ivanhoe Ave
- 1032 D St
- 238 N Charlotte Ave
- 364 N Bath Ave
- 1207 4th St
- 360 Dinwiddie Ave Unit 356-360-364,164-166,
- 529 N Augusta Ave
- 421 N Charlotte Ave
- 600 N Bayard Ave