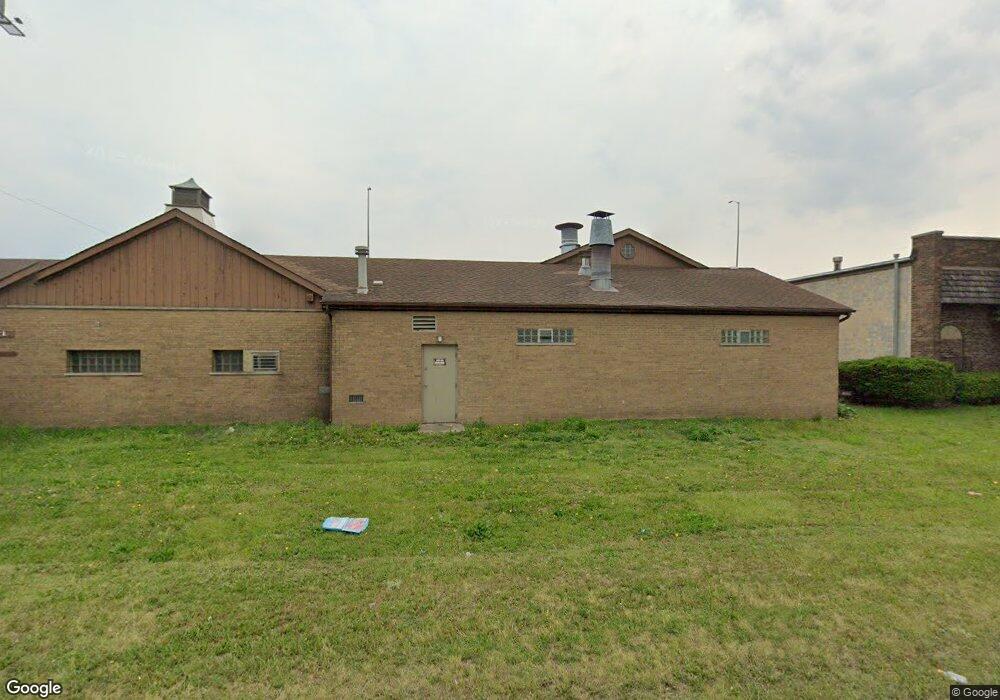
1221 171st St East Hazel Crest, IL 60429
--
Bed
--
Bath
--
Sq Ft
0.35
Acres
About This Home
This home is located at 1221 171st St, East Hazel Crest, IL 60429. 1221 171st St is a home located in Cook County with nearby schools including Thornwood High School.
Ownership History
Date
Name
Owned For
Owner Type
Purchase Details
Closed on
Apr 27, 2021
Sold by
Letts David and Letts Sandy
Bought by
121 171St St Llc
Purchase Details
Closed on
Dec 13, 2014
Sold by
Standard Bank & Trust Company
Bought by
Marquette Bank
Purchase Details
Closed on
Dec 12, 2012
Sold by
Grivetti Valentina M
Bought by
David And Sandy Letts Living Trust
Purchase Details
Closed on
Jun 19, 2002
Sold by
Lasalle Bank National Assn
Bought by
Standard Bank & Trust Company and Trust #17349
Home Financials for this Owner
Home Financials are based on the most recent Mortgage that was taken out on this home.
Original Mortgage
$377,400
Interest Rate
7.5%
Mortgage Type
Commercial
Create a Home Valuation Report for This Property
The Home Valuation Report is an in-depth analysis detailing your home's value as well as a comparison with similar homes in the area
Home Values in the Area
Average Home Value in this Area
Purchase History
| Date | Buyer | Sale Price | Title Company |
|---|---|---|---|
| 121 171St St Llc | $470,000 | Chicago Title | |
| Marquette Bank | -- | Git | |
| David And Sandy Letts Living Trust | $175,000 | Fidelity National Title | |
| Standard Bank & Trust Company | $281,500 | -- |
Source: Public Records
Mortgage History
| Date | Status | Borrower | Loan Amount |
|---|---|---|---|
| Previous Owner | Standard Bank & Trust Company | $377,400 |
Source: Public Records
Tax History Compared to Growth
Tax History
| Year | Tax Paid | Tax Assessment Tax Assessment Total Assessment is a certain percentage of the fair market value that is determined by local assessors to be the total taxable value of land and additions on the property. | Land | Improvement |
|---|---|---|---|---|
| 2024 | $19,436 | $37,396 | $21,420 | $15,976 |
| 2023 | $23,086 | $37,396 | $21,420 | $15,976 |
| 2022 | $23,086 | $35,477 | $21,420 | $14,057 |
| 2021 | $22,662 | $35,476 | $21,420 | $14,056 |
| 2020 | $17,820 | $29,084 | $21,420 | $7,664 |
| 2019 | $12,677 | $21,198 | $16,065 | $5,133 |
| 2018 | $12,537 | $21,198 | $16,065 | $5,133 |
| 2017 | $12,600 | $21,198 | $16,065 | $5,133 |
| 2016 | $11,142 | $19,857 | $14,280 | $5,577 |
| 2015 | $10,776 | $19,857 | $14,280 | $5,577 |
| 2014 | $10,569 | $19,857 | $14,280 | $5,577 |
| 2013 | $9,782 | $19,914 | $14,280 | $5,634 |
Source: Public Records
Map
Nearby Homes
- 1113 171st St
- 1321 172nd St
- 1025 171st St
- 1409 172nd St
- 1411 172nd St
- 1100 173rd St
- 1001 172nd St
- 1314 174th St
- 17231 Laflin Ave
- 17406 Throop St
- 17304 Lathrop Ave
- 1514 173rd St
- 1710 169th St
- 16929 Wood St
- 16919 Wood St
- 16604 Finch Ave
- 16619 Marshfield Ave
- 16611 Marshfield Ave
- 16259 Center St
- 16637 Paulina St