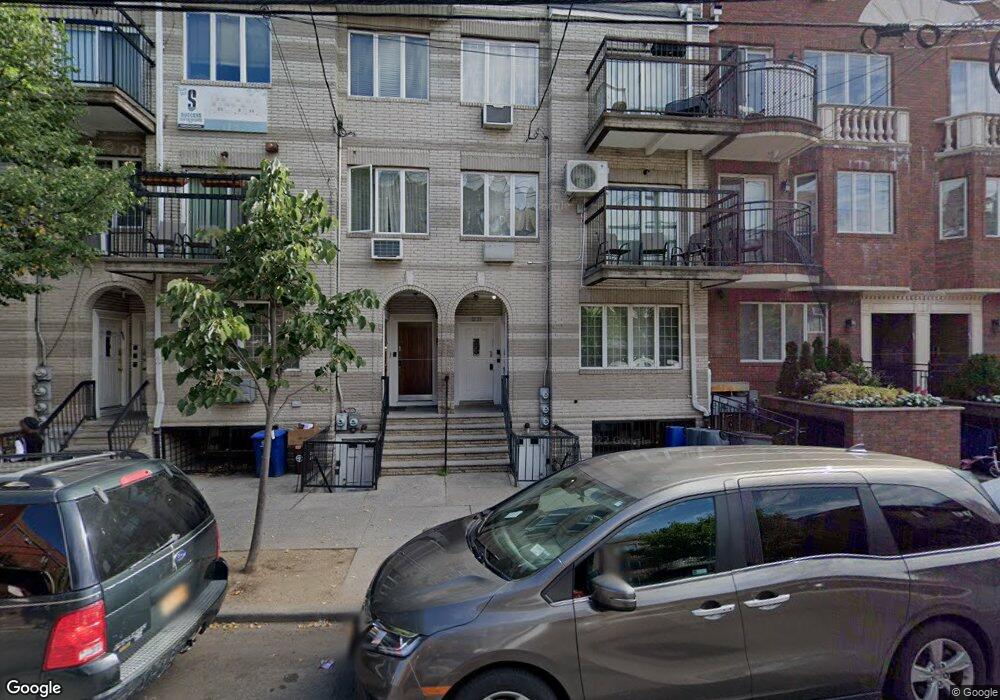
1221 43rd St Unit 1 Brooklyn, NY 11219
Borough Park NeighborhoodEstimated Value: $1,093,000 - $1,493,000
--
Bed
--
Bath
1,715
Sq Ft
$742/Sq Ft
Est. Value
About This Home
This home is located at 1221 43rd St Unit 1, Brooklyn, NY 11219 and is currently estimated at $1,272,377, approximately $741 per square foot. 1221 43rd St Unit 1 is a home located in Kings County with nearby schools including P.S. 131 Brooklyn, I.S. 223 The Montauk, and Franklin Delano Roosevelt High School.
Ownership History
Date
Name
Owned For
Owner Type
Purchase Details
Closed on
Aug 14, 2023
Sold by
Bronner Baruch D and Bronner Saindi
Bought by
Bronner Rachel
Current Estimated Value
Purchase Details
Closed on
May 11, 2006
Sold by
Zaidman Chava and Zaidman Yehoshua
Bought by
Bronner Baruch David and Bronner Saindi
Home Financials for this Owner
Home Financials are based on the most recent Mortgage that was taken out on this home.
Original Mortgage
$417,000
Outstanding Balance
$244,535
Interest Rate
6.62%
Mortgage Type
Purchase Money Mortgage
Estimated Equity
$1,027,842
Purchase Details
Closed on
Mar 30, 1994
Sold by
Citywide Success Enterprises Inc
Bought by
Zaidman Yehoshua and Zaidman Chava
Home Financials for this Owner
Home Financials are based on the most recent Mortgage that was taken out on this home.
Original Mortgage
$192,000
Interest Rate
7.7%
Mortgage Type
Purchase Money Mortgage
Create a Home Valuation Report for This Property
The Home Valuation Report is an in-depth analysis detailing your home's value as well as a comparison with similar homes in the area
Home Values in the Area
Average Home Value in this Area
Purchase History
| Date | Buyer | Sale Price | Title Company |
|---|---|---|---|
| Bronner Rachel | -- | -- | |
| Bronner Baruch David | $650,000 | -- | |
| Bronner Baruch David | $650,000 | -- | |
| Zaidman Yehoshua | -- | -- | |
| Zaidman Yehoshua | -- | -- |
Source: Public Records
Mortgage History
| Date | Status | Borrower | Loan Amount |
|---|---|---|---|
| Open | Bronner Baruch David | $417,000 | |
| Closed | Bronner Baruch David | $417,000 | |
| Previous Owner | Zaidman Yehoshua | $192,000 |
Source: Public Records
Tax History Compared to Growth
Tax History
| Year | Tax Paid | Tax Assessment Tax Assessment Total Assessment is a certain percentage of the fair market value that is determined by local assessors to be the total taxable value of land and additions on the property. | Land | Improvement |
|---|---|---|---|---|
| 2025 | $5,061 | $72,279 | $2,165 | $70,114 |
| 2024 | $5,061 | $57,098 | $2,165 | $54,933 |
| 2023 | $4,828 | $55,858 | $2,165 | $53,693 |
| 2022 | $4,478 | $51,506 | $2,165 | $49,341 |
| 2021 | $4,454 | $48,395 | $2,165 | $46,230 |
| 2020 | $2,214 | $48,634 | $2,165 | $46,469 |
| 2019 | $4,393 | $48,634 | $2,165 | $46,469 |
| 2018 | $4,039 | $19,812 | $949 | $18,863 |
| 2017 | $3,810 | $18,692 | $967 | $17,725 |
| 2016 | $3,525 | $17,635 | $1,023 | $16,612 |
| 2015 | $2,127 | $17,635 | $998 | $16,637 |
| 2014 | $2,127 | $17,500 | $842 | $16,658 |
Source: Public Records
Map
Nearby Homes
- 1240 43rd St
- 1227 40th St
- 4409 New Utrecht Ave
- 4709 New Utrecht Ave
- 4518 11th Ave
- 4726 New Utrecht Ave
- 1115 40th St
- 3809 12th Ave
- 1025 45th St Unit 3F
- 1025 45th St Unit 4D
- 3902 Fort Hamilton Pkwy
- 1271 38th St
- 4924 13th Ave
- 4107 New Utrecht Ave
- 4105 New Utrecht Ave
- 4103 10th Ave
- 4019 10th Ave
- 1026 39th St
- 1117 51st St
- 4906 Fort Hamilton Pkwy
- 1221 44th St Unit 3
- 1221 44th St Unit 2
- 1221 44th St Unit 1
- 1221 43rd St Unit 3
- 1221 43rd St Unit 2
- 1221 43rd St
- 1217 44th St
- 1225 44th St Unit 6B
- 1225 44th St Unit 5B
- 1225 44th St Unit 4B
- 1225 44th St Unit 3B
- 1225 44th St Unit 2B
- 1225 44th St Unit 1B
- 1227 44th St Unit 6A
- 1227 44th St Unit 5A
- 1227 44th St Unit 4A
- 1227 44th St Unit 3A
- 1227 44th St Unit 2A
- 1227 44th St Unit 1A
- 1227 44th St