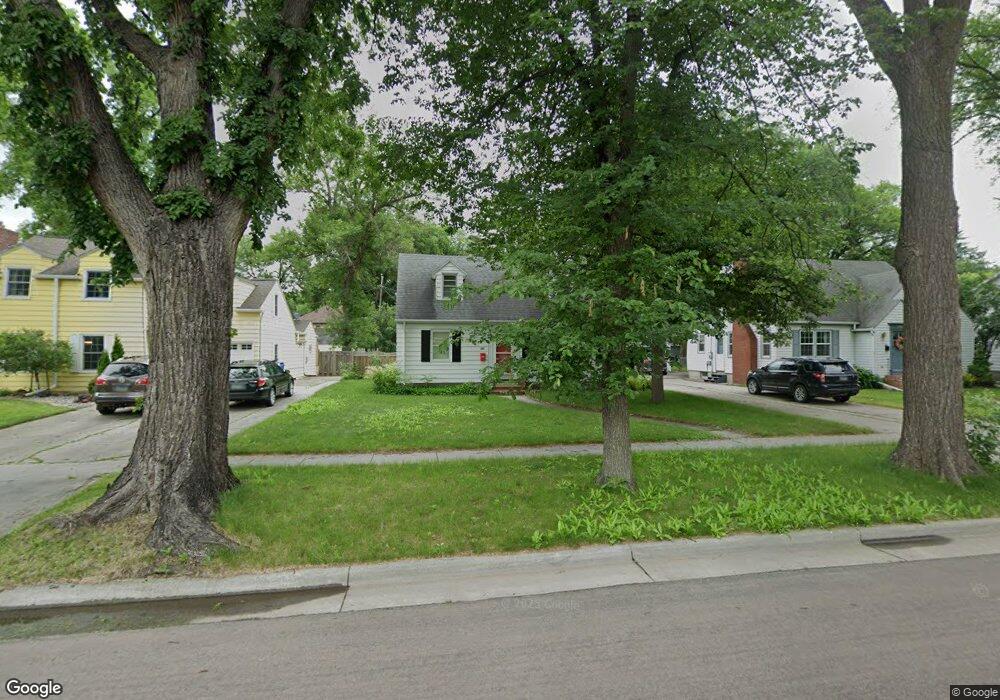
1221 7th St N Fargo, ND 58102
Roosevelt NeighborhoodEstimated Value: $260,444 - $290,000
5
Beds
2
Baths
1,700
Sq Ft
$162/Sq Ft
Est. Value
About This Home
This home is located at 1221 7th St N, Fargo, ND 58102 and is currently estimated at $274,861, approximately $161 per square foot. 1221 7th St N is a home located in Cass County with nearby schools including Horace Mann Roosevelt Elementary School, Ben Franklin Middle School, and North High School.
Ownership History
Date
Name
Owned For
Owner Type
Purchase Details
Closed on
Feb 4, 2016
Sold by
Killoran Mary E and Eberhard Mary E
Bought by
Eberhard Brett D
Current Estimated Value
Home Financials for this Owner
Home Financials are based on the most recent Mortgage that was taken out on this home.
Original Mortgage
$141,000
Outstanding Balance
$112,585
Interest Rate
4%
Mortgage Type
New Conventional
Estimated Equity
$162,276
Purchase Details
Closed on
Sep 11, 2008
Sold by
Fortin Eric and Fortin Kaye
Bought by
Eberhard Brett D and Killoran Mary E
Home Financials for this Owner
Home Financials are based on the most recent Mortgage that was taken out on this home.
Original Mortgage
$147,283
Interest Rate
5.25%
Mortgage Type
FHA
Purchase Details
Closed on
May 24, 2006
Sold by
Sorensen Bret L and Sorensen Susan J
Bought by
Fortin Eric
Home Financials for this Owner
Home Financials are based on the most recent Mortgage that was taken out on this home.
Original Mortgage
$160,350
Interest Rate
5.25%
Mortgage Type
VA
Create a Home Valuation Report for This Property
The Home Valuation Report is an in-depth analysis detailing your home's value as well as a comparison with similar homes in the area
Home Values in the Area
Average Home Value in this Area
Purchase History
| Date | Buyer | Sale Price | Title Company |
|---|---|---|---|
| Eberhard Brett D | -- | Title Co | |
| Eberhard Brett D | -- | -- | |
| Fortin Eric | $157,000 | -- |
Source: Public Records
Mortgage History
| Date | Status | Borrower | Loan Amount |
|---|---|---|---|
| Open | Eberhard Brett D | $141,000 | |
| Previous Owner | Eberhard Brett D | $147,283 | |
| Previous Owner | Fortin Eric | $160,350 |
Source: Public Records
Tax History Compared to Growth
Tax History
| Year | Tax Paid | Tax Assessment Tax Assessment Total Assessment is a certain percentage of the fair market value that is determined by local assessors to be the total taxable value of land and additions on the property. | Land | Improvement |
|---|---|---|---|---|
| 2024 | $3,303 | $119,300 | $23,500 | $95,800 |
| 2023 | $3,786 | $119,300 | $23,500 | $95,800 |
| 2022 | $3,517 | $106,500 | $23,500 | $83,000 |
| 2021 | $3,161 | $95,100 | $23,500 | $71,600 |
| 2020 | $3,128 | $95,100 | $23,500 | $71,600 |
| 2019 | $3,625 | $114,000 | $13,950 | $100,050 |
| 2018 | $3,589 | $114,000 | $13,950 | $100,050 |
| 2017 | $3,363 | $108,550 | $13,950 | $94,600 |
| 2016 | $2,919 | $101,450 | $13,950 | $87,500 |
| 2015 | $3,079 | $101,450 | $9,550 | $91,900 |
| 2014 | $2,403 | $72,700 | $9,550 | $63,150 |
| 2013 | $2,384 | $72,700 | $9,550 | $63,150 |
Source: Public Records
Map
Nearby Homes