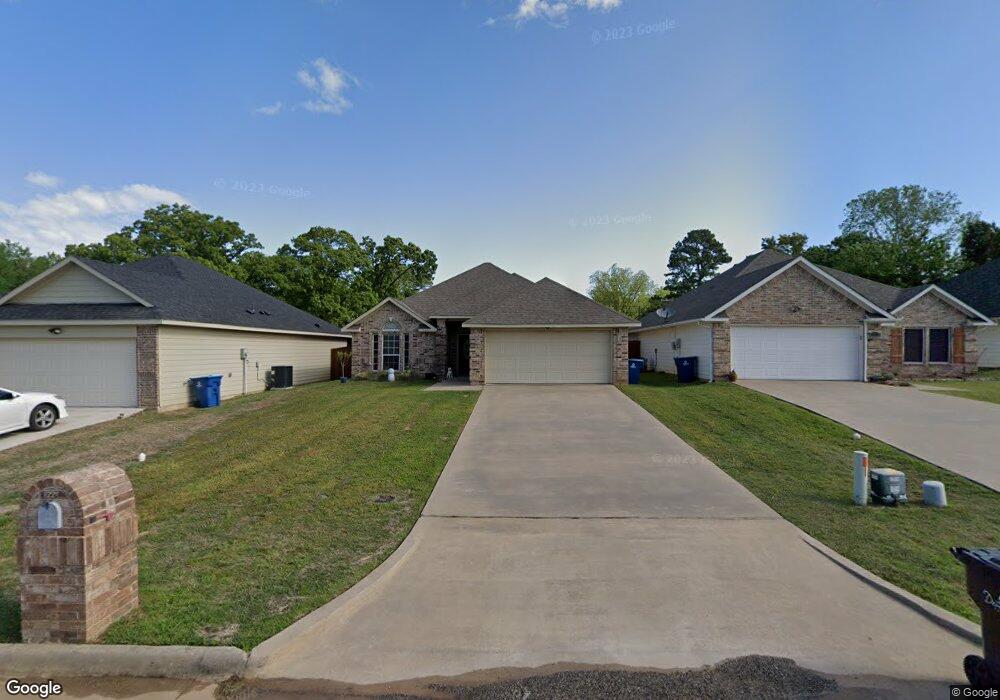
1221 Amsden Cir Denison, TX 75020
Estimated Value: $224,362 - $249,000
3
Beds
2
Baths
1,323
Sq Ft
$179/Sq Ft
Est. Value
About This Home
This home is located at 1221 Amsden Cir, Denison, TX 75020 and is currently estimated at $236,681, approximately $178 per square foot. 1221 Amsden Cir is a home located in Grayson County with nearby schools including Scott Middle School, Denison High School, and St. Luke's Parish Day School.
Ownership History
Date
Name
Owned For
Owner Type
Purchase Details
Closed on
Apr 1, 2020
Sold by
Murray Dana and Thornhill Ernest
Bought by
Landeck Gary and Landeck Melinda S
Current Estimated Value
Home Financials for this Owner
Home Financials are based on the most recent Mortgage that was taken out on this home.
Original Mortgage
$159,600
Outstanding Balance
$141,386
Interest Rate
3.4%
Mortgage Type
New Conventional
Estimated Equity
$95,295
Purchase Details
Closed on
Oct 19, 2007
Sold by
Pettit Randy
Bought by
Murray Dana
Home Financials for this Owner
Home Financials are based on the most recent Mortgage that was taken out on this home.
Original Mortgage
$118,600
Interest Rate
6.47%
Mortgage Type
Purchase Money Mortgage
Purchase Details
Closed on
Jun 15, 2007
Sold by
Wood Richard
Bought by
Pettit Randy
Home Financials for this Owner
Home Financials are based on the most recent Mortgage that was taken out on this home.
Original Mortgage
$87,200
Interest Rate
6.15%
Mortgage Type
Commercial
Create a Home Valuation Report for This Property
The Home Valuation Report is an in-depth analysis detailing your home's value as well as a comparison with similar homes in the area
Home Values in the Area
Average Home Value in this Area
Purchase History
| Date | Buyer | Sale Price | Title Company |
|---|---|---|---|
| Landeck Gary | -- | Red River Title Co | |
| Murray Dana | -- | Grayson County Title | |
| Pettit Randy | -- | Grayson County Title |
Source: Public Records
Mortgage History
| Date | Status | Borrower | Loan Amount |
|---|---|---|---|
| Open | Landeck Gary | $159,600 | |
| Previous Owner | Murray Dana | $118,600 | |
| Previous Owner | Pettit Randy | $87,200 |
Source: Public Records
Tax History Compared to Growth
Tax History
| Year | Tax Paid | Tax Assessment Tax Assessment Total Assessment is a certain percentage of the fair market value that is determined by local assessors to be the total taxable value of land and additions on the property. | Land | Improvement |
|---|---|---|---|---|
| 2025 | $3,781 | $228,201 | $48,580 | $179,621 |
| 2024 | $5,078 | $218,578 | $0 | $0 |
| 2023 | $3,204 | $198,707 | $0 | $0 |
| 2022 | $4,292 | $180,643 | $0 | $0 |
| 2021 | $4,142 | $164,221 | $28,000 | $136,221 |
| 2020 | $4,238 | $160,685 | $19,670 | $141,015 |
| 2019 | $4,384 | $159,310 | $19,670 | $139,640 |
| 2018 | $4,116 | $148,369 | $19,670 | $128,699 |
| 2017 | $3,871 | $138,384 | $11,750 | $126,634 |
| 2016 | $2,960 | $105,815 | $11,750 | $94,065 |
| 2015 | $0 | $103,898 | $11,750 | $92,148 |
| 2014 | -- | $103,898 | $11,750 | $92,148 |
Source: Public Records
Map
Nearby Homes
- 1130 Amsden Cir
- 3101 S College Blvd
- 938 Amsden St
- 3312 Vine Ln
- 905 Seymore Cir
- 923 Dubois St
- 903 Seymore Cir
- 603 W Star St
- 916 W Collins St
- 923 W Collins St
- 921 W Collins St
- 919 W Collins St
- 1901 Woodlawn Blvd
- 711 Dubois St
- 700 Dubois St
- 701 W Star St
- 527 W Coffin St
- 930 W Florence St
- 1803 Woodland Park Dr
- 904 W Florence St
- 1217 Amsden Cir
- 1225 Amsden Cir
- 1213 Amsden Cir
- 1229 Amsden Cir
- 1209 Amsden Cir
- 1205 Amsden Cir
- 1046 Thatcher St
- 1218 Amsden Cir
- 1214 Amsden Cir
- 1222 Amsden Cir
- 000000 Amsden Cir
- 1210 Amsden Cir
- 1226 Amsden Cir
- 1206 Amsden Cir
- 1036 Thatcher St
- 1201 Amsden Cir
- 1202 Amsden Cir
- 1230 Amsden Cir
- 1200 Amsden Cir
- 1032 Thatcher St