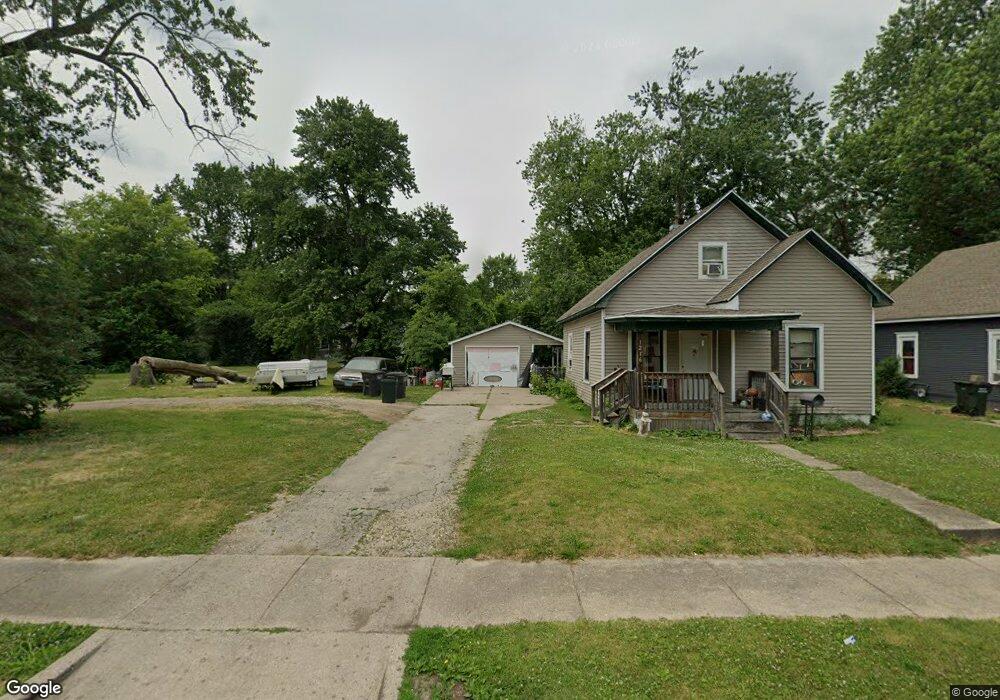
1221 Chandler St Danville, IL 61832
Estimated Value: $56,000 - $74,000
--
Bed
--
Bath
--
Sq Ft
0.29
Acres
About This Home
This home is located at 1221 Chandler St, Danville, IL 61832 and is currently estimated at $67,289. 1221 Chandler St is a home located in Vermilion County with nearby schools including Garfield Elementary School, Liberty Elementary School, and North Ridge Middle School.
Ownership History
Date
Name
Owned For
Owner Type
Purchase Details
Closed on
Jan 4, 2025
Sold by
Grandeur Capital Llc
Bought by
Tiger Estates Series Llc
Current Estimated Value
Home Financials for this Owner
Home Financials are based on the most recent Mortgage that was taken out on this home.
Original Mortgage
$504,800
Outstanding Balance
$501,295
Interest Rate
6.81%
Mortgage Type
New Conventional
Estimated Equity
-$434,006
Purchase Details
Closed on
Jul 17, 2023
Sold by
633 Properties Llc
Bought by
Grandeur Capital Llc
Home Financials for this Owner
Home Financials are based on the most recent Mortgage that was taken out on this home.
Original Mortgage
$271,150
Interest Rate
6.07%
Mortgage Type
New Conventional
Purchase Details
Closed on
Dec 31, 2022
Sold by
Ecom Optimization Llc
Bought by
2T Ventures Llc
Purchase Details
Closed on
Aug 5, 2021
Sold by
Cox Donald E and Cox Mary E
Bought by
Ecom Optimization Llc
Create a Home Valuation Report for This Property
The Home Valuation Report is an in-depth analysis detailing your home's value as well as a comparison with similar homes in the area
Home Values in the Area
Average Home Value in this Area
Purchase History
| Date | Buyer | Sale Price | Title Company |
|---|---|---|---|
| Tiger Estates Series Llc | $675,000 | None Listed On Document | |
| Grandeur Capital Llc | $319,000 | None Listed On Document | |
| 2T Ventures Llc | -- | -- | |
| Ecom Optimization Llc | $108,000 | Deckert & Wiles Llc |
Source: Public Records
Mortgage History
| Date | Status | Borrower | Loan Amount |
|---|---|---|---|
| Open | Tiger Estates Series Llc | $504,800 | |
| Previous Owner | Grandeur Capital Llc | $271,150 |
Source: Public Records
Tax History Compared to Growth
Tax History
| Year | Tax Paid | Tax Assessment Tax Assessment Total Assessment is a certain percentage of the fair market value that is determined by local assessors to be the total taxable value of land and additions on the property. | Land | Improvement |
|---|---|---|---|---|
| 2024 | $1,740 | $18,967 | $4,831 | $14,136 |
| 2023 | $1,715 | $16,289 | $4,149 | $12,140 |
| 2022 | $1,534 | $14,423 | $3,674 | $10,749 |
| 2021 | $1,464 | $13,355 | $3,402 | $9,953 |
| 2020 | $1,426 | $12,903 | $3,287 | $9,616 |
| 2019 | $1,453 | $12,903 | $3,287 | $9,616 |
| 2018 | $1,410 | $12,839 | $3,271 | $9,568 |
| 2015 | $1,353 | $11,403 | $2,905 | $8,498 |
| 2014 | $1,353 | $11,403 | $2,905 | $8,498 |
| 2013 | $1,353 | $11,403 | $2,905 | $8,498 |
Source: Public Records
Map
Nearby Homes
- 1203 N Grant St
- 1210 N Gilbert St
- 603 W English St
- 1305 N Gilbert St
- 809 W Columbia St
- 1306 N Franklin St
- 1216 N Logan Ave
- 1206 N Vermilion St
- 1003 N Franklin St
- 1511 Oak St
- 1603 Chandler St
- 1020 N Vermilion St
- 16 Lincolnshire Ave
- 716 Robinson St
- 52 Maywood Dr
- 520 Sherman St
- 1020 W Williams St
- 1145 Lakeridge Rd
- 1712 N Gilbert St
- 1203 Lakeridge Ct
- 1219 Chandler St
- 1217 Chandler St
- 1222 Chandler St
- 1215 Chandler St
- 1220 Chandler St
- 1218 Chandler St
- 1224 Chandler St
- 607 W Voorhees St
- 1213 Chandler St
- 1222 Harmon St
- 1218 Harmon St
- 1224 Harmon St
- 1220 Harmon St
- 1302 Chandler St
- 1216 Chandler St
- 1216 Harmon St
- 1211 Chandler St
- 1303 Chandler St
- 1214 Harmon St
- 1304 Chandler St