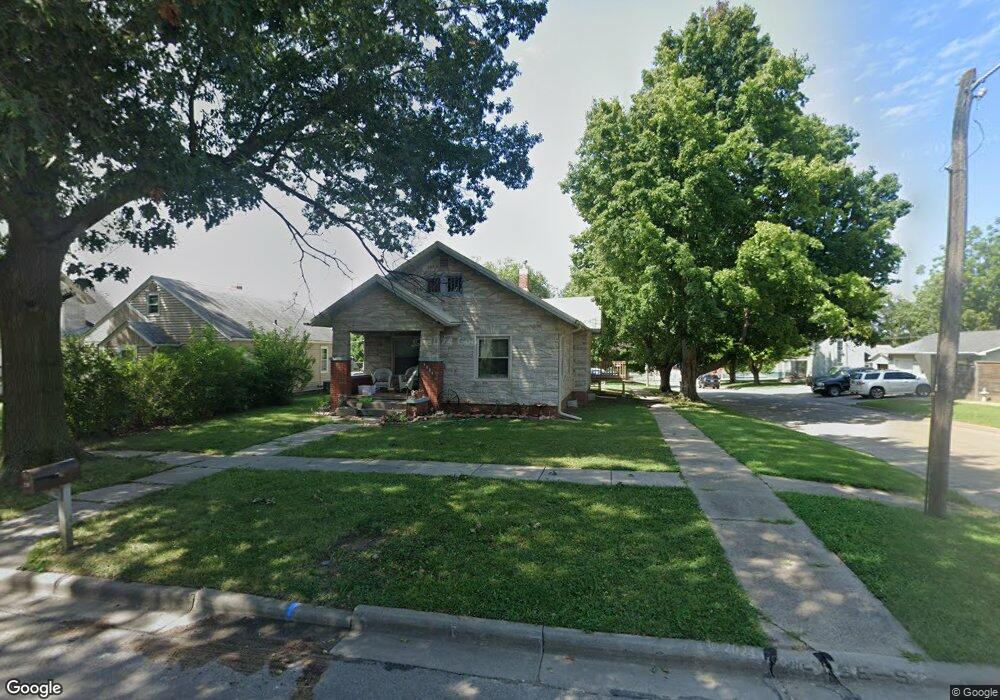
1221 Chase St Falls City, NE 68355
Estimated Value: $76,000 - $96,883
2
Beds
1
Bath
1,154
Sq Ft
$74/Sq Ft
Est. Value
About This Home
This home is located at 1221 Chase St, Falls City, NE 68355 and is currently estimated at $85,471, approximately $74 per square foot. 1221 Chase St is a home located in Richardson County with nearby schools including Falls City North Elementary School, Falls City South Elementary School, and Falls City Middle School.
Ownership History
Date
Name
Owned For
Owner Type
Purchase Details
Closed on
Nov 13, 2023
Sold by
Nguyen Thi
Bought by
Campbell Nancy J
Current Estimated Value
Purchase Details
Closed on
Aug 23, 2010
Sold by
Secretary Of Housing And Urban Developme
Bought by
Feighner Delores F and Feighner Christa F
Purchase Details
Closed on
Oct 5, 2009
Sold by
Darveau Jr Steven J
Bought by
Wells Fargo Bank Na
Purchase Details
Closed on
Dec 27, 2001
Sold by
Jaros Dora L
Bought by
Darveau Jr Steven J
Create a Home Valuation Report for This Property
The Home Valuation Report is an in-depth analysis detailing your home's value as well as a comparison with similar homes in the area
Home Values in the Area
Average Home Value in this Area
Purchase History
| Date | Buyer | Sale Price | Title Company |
|---|---|---|---|
| Campbell Nancy J | $55,000 | -- | |
| Feighner Delores F | -- | -- | |
| Wells Fargo Bank Na | $28,985 | -- | |
| Darveau Jr Steven J | $26,000 | -- |
Source: Public Records
Tax History Compared to Growth
Tax History
| Year | Tax Paid | Tax Assessment Tax Assessment Total Assessment is a certain percentage of the fair market value that is determined by local assessors to be the total taxable value of land and additions on the property. | Land | Improvement |
|---|---|---|---|---|
| 2025 | $720 | $59,548 | $2,880 | $56,668 |
| 2024 | $720 | $56,340 | $2,880 | $53,460 |
| 2023 | $571 | $34,820 | $2,880 | $31,940 |
| 2022 | $968 | $50,425 | $1,555 | $48,870 |
| 2021 | $904 | $48,257 | $1,555 | $46,702 |
| 2020 | $872 | $46,033 | $1,555 | $44,478 |
| 2019 | $861 | $44,738 | $1,555 | $43,183 |
| 2018 | $845 | $43,480 | $1,555 | $41,925 |
| 2017 | $846 | $43,480 | $1,555 | $41,925 |
| 2016 | $818 | $42,259 | $1,555 | $40,704 |
| 2015 | $821 | $42,259 | $1,555 | $40,704 |
| 2014 | $820 | $42,259 | $1,555 | $40,704 |
Source: Public Records
Map
Nearby Homes