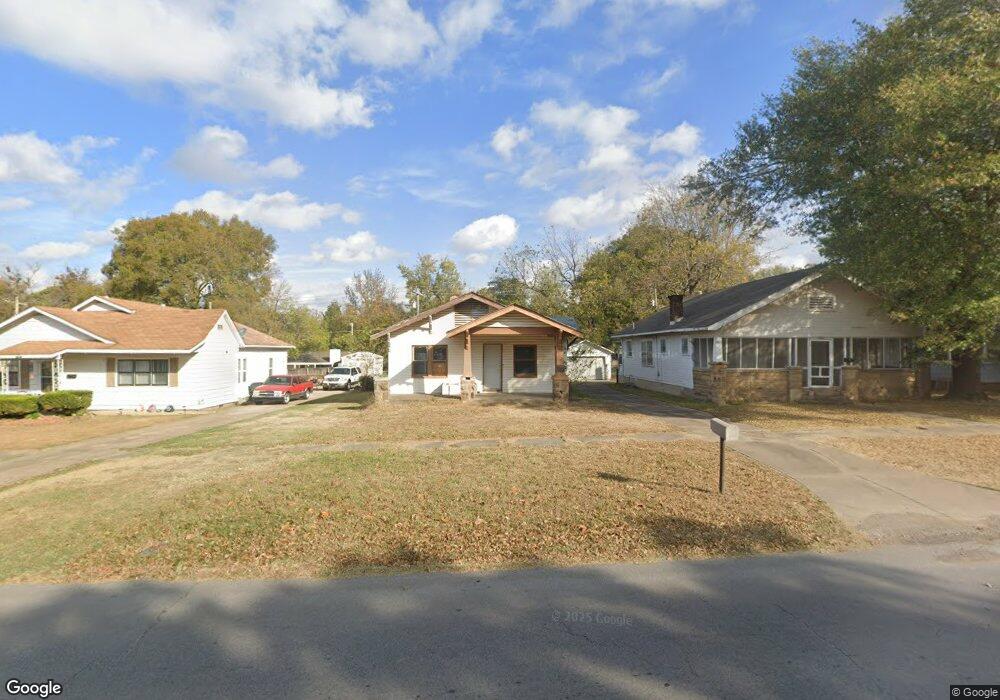
1221 E 8th St Okmulgee, OK 74447
Estimated Value: $53,000 - $134,000
2
Beds
1
Bath
1,342
Sq Ft
$65/Sq Ft
Est. Value
About This Home
This home is located at 1221 E 8th St, Okmulgee, OK 74447 and is currently estimated at $87,265, approximately $65 per square foot. 1221 E 8th St is a home located in Okmulgee County with nearby schools including Okmulgee Primary School, Dunbar Elementary School, and Okmulgee Middle School.
Ownership History
Date
Name
Owned For
Owner Type
Purchase Details
Closed on
Sep 19, 2025
Sold by
Andrews Robert Shawn and Andrews Katherine Elizabeth
Bought by
Sample Anthony Ray
Current Estimated Value
Purchase Details
Closed on
May 23, 2025
Sold by
Andrews Robert and Stinnett Anita
Bought by
Andrews Robert and Andrews Katherine
Purchase Details
Closed on
Oct 16, 2018
Sold by
Between Ditech Financial Llc
Bought by
Stinnett Anita Mary Elizabeth and Andrews Shawn
Purchase Details
Closed on
Apr 9, 2018
Sold by
Pike Michael and Pike Angelia
Bought by
Ditech Financial Llc
Purchase Details
Closed on
Mar 30, 2007
Sold by
Swartz & Brough Inc and Morris Leda
Bought by
Pike Michael and Pike Angelia
Home Financials for this Owner
Home Financials are based on the most recent Mortgage that was taken out on this home.
Original Mortgage
$23,400
Interest Rate
6.16%
Mortgage Type
Purchase Money Mortgage
Purchase Details
Closed on
Jan 23, 2007
Sold by
Secretary Of Hud
Bought by
Swartz & Brough Inc
Purchase Details
Closed on
Aug 22, 2006
Sold by
Wallace Claudetta L and Brinkley Claudetta L
Bought by
Secretary Of Hud
Create a Home Valuation Report for This Property
The Home Valuation Report is an in-depth analysis detailing your home's value as well as a comparison with similar homes in the area
Home Values in the Area
Average Home Value in this Area
Purchase History
| Date | Buyer | Sale Price | Title Company |
|---|---|---|---|
| Sample Anthony Ray | -- | None Listed On Document | |
| Andrews Robert | -- | None Listed On Document | |
| Andrews Robert | -- | None Listed On Document | |
| Stinnett Anita Mary Elizabeth | $6,000 | None Available | |
| Ditech Financial Llc | -- | None Available | |
| Pike Michael | $26,000 | None Available | |
| Swartz & Brough Inc | -- | None Available | |
| Secretary Of Hud | -- | None Available |
Source: Public Records
Mortgage History
| Date | Status | Borrower | Loan Amount |
|---|---|---|---|
| Previous Owner | Pike Michael | $23,400 |
Source: Public Records
Tax History
| Year | Tax Paid | Tax Assessment Tax Assessment Total Assessment is a certain percentage of the fair market value that is determined by local assessors to be the total taxable value of land and additions on the property. | Land | Improvement |
|---|---|---|---|---|
| 2025 | $315 | $3,440 | $360 | $3,080 |
| 2024 | $315 | $3,440 | $360 | $3,080 |
| 2023 | $270 | $3,120 | $360 | $2,760 |
| 2022 | $264 | $3,120 | $360 | $2,760 |
| 2021 | $276 | $3,120 | $360 | $2,760 |
| 2020 | $276 | $3,123 | $360 | $2,763 |
| 2019 | $275 | $3,115 | $360 | $2,755 |
| 2018 | $191 | $3,138 | $360 | $2,778 |
| 2017 | $181 | $3,047 | $360 | $2,687 |
| 2016 | $174 | $2,958 | $360 | $2,598 |
| 2015 | $148 | $2,718 | $360 | $2,358 |
| 2014 | $149 | $2,718 | $360 | $2,358 |
Source: Public Records
Map
Nearby Homes
Your Personal Tour Guide
Ask me questions while you tour the home.