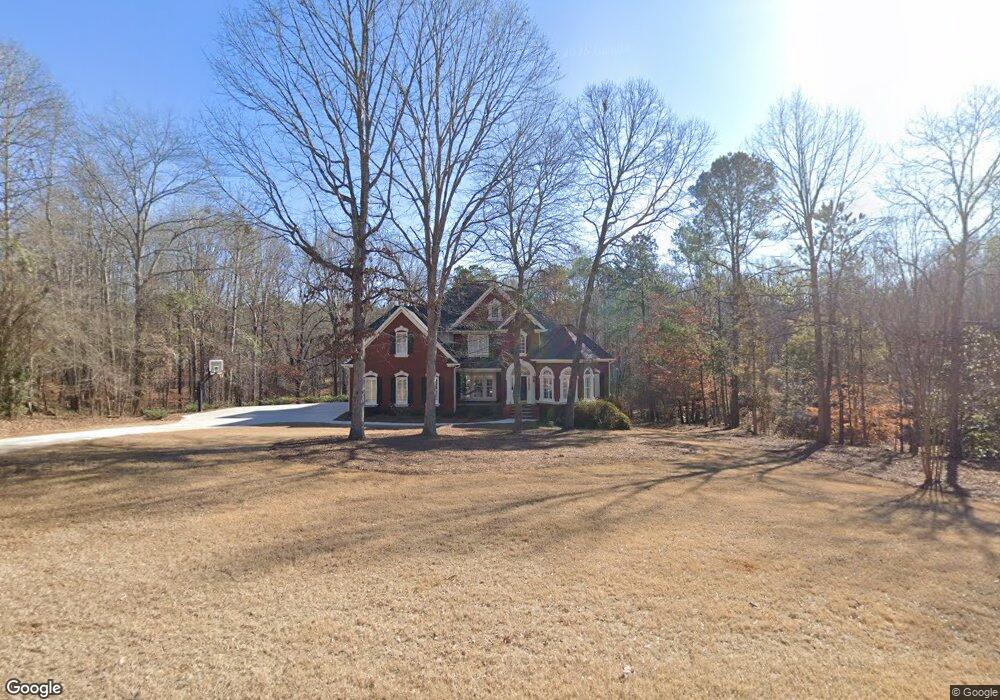
1221 Knob Creek Dr Athens, GA 30606
Estimated Value: $1,017,000 - $1,084,000
5
Beds
5
Baths
5,341
Sq Ft
$195/Sq Ft
Est. Value
About This Home
This home is located at 1221 Knob Creek Dr, Athens, GA 30606 and is currently estimated at $1,041,658, approximately $195 per square foot. 1221 Knob Creek Dr is a home located in Oconee County with nearby schools including Oconee County Elementary School, Oconee County Primary School, and Oconee County Middle School.
Ownership History
Date
Name
Owned For
Owner Type
Purchase Details
Closed on
Oct 5, 2023
Sold by
Dickens Gina Griffeth
Bought by
Knob Creek Spartans Llc
Current Estimated Value
Purchase Details
Closed on
Mar 18, 2020
Sold by
Broun Paul C
Bought by
Dickens Gina Griffeth
Home Financials for this Owner
Home Financials are based on the most recent Mortgage that was taken out on this home.
Original Mortgage
$452,000
Interest Rate
3.4%
Mortgage Type
New Conventional
Purchase Details
Closed on
May 9, 2006
Sold by
Not Provided
Bought by
Broun Paul C
Home Financials for this Owner
Home Financials are based on the most recent Mortgage that was taken out on this home.
Original Mortgage
$300,000
Interest Rate
6.39%
Mortgage Type
New Conventional
Purchase Details
Closed on
Jun 22, 2001
Sold by
Rockinwood Inc
Bought by
Frances-Dyett Delrose
Create a Home Valuation Report for This Property
The Home Valuation Report is an in-depth analysis detailing your home's value as well as a comparison with similar homes in the area
Home Values in the Area
Average Home Value in this Area
Purchase History
| Date | Buyer | Sale Price | Title Company |
|---|---|---|---|
| Knob Creek Spartans Llc | -- | -- | |
| Dickens Gina Griffeth | $565,000 | -- | |
| Broun Paul C | $500,000 | -- | |
| Frances-Dyett Delrose | $47,000 | -- |
Source: Public Records
Mortgage History
| Date | Status | Borrower | Loan Amount |
|---|---|---|---|
| Previous Owner | Dickens Gina Griffeth | $452,000 | |
| Previous Owner | Broun Paul C | $300,000 |
Source: Public Records
Tax History Compared to Growth
Tax History
| Year | Tax Paid | Tax Assessment Tax Assessment Total Assessment is a certain percentage of the fair market value that is determined by local assessors to be the total taxable value of land and additions on the property. | Land | Improvement |
|---|---|---|---|---|
| 2024 | $5,738 | $305,580 | $34,650 | $270,930 |
| 2023 | $5,710 | $303,678 | $33,600 | $270,078 |
| 2022 | $5,891 | $274,596 | $33,600 | $240,996 |
| 2021 | $5,232 | $244,663 | $33,600 | $211,063 |
| 2020 | $4,678 | $203,754 | $33,600 | $170,154 |
| 2019 | $4,566 | $198,943 | $33,600 | $165,343 |
| 2018 | $4,389 | $187,292 | $33,600 | $153,692 |
| 2017 | $4,318 | $184,313 | $33,600 | $150,713 |
| 2016 | $4,295 | $183,334 | $33,600 | $149,734 |
| 2015 | $4,313 | $183,692 | $33,600 | $150,092 |
| 2014 | $4,275 | $178,025 | $33,600 | $144,425 |
| 2013 | -- | $173,287 | $33,600 | $139,687 |
Source: Public Records
Map
Nearby Homes
- 8420 Macon Hwy
- 1180 Allgood Rd
- 1763 Olympus Ct
- 1391 Ivywood Dr
- 1050 Summit Oaks Dr
- 8660 Macon Hwy
- 1240 Summit Dr
- 1010 Overton Way
- 2880 Spartan Estates Dr
- 8580 Macon Hwy
- 1250 Calls Creek Cir
- 1001 Moreland Dr
- 3119 Spartan Estates Dr
- 1040 Thomas Ave
- 1051 Simonton Way
- 2041 Simonton Bridge Rd
- 2481 Lakewood Manor Dr
- 2240 Simonton Bridge Rd
- 1201 Knob Creek Dr
- 1241 Knob Creek Dr
- 1020 Knox Ridge
- 1200 Knob Creek Dr
- 1250 Knob Creek Dr
- 1170 Knob Creek Dr
- 1261 Knob Creek Dr
- 1160 Mason Mill Rd
- 0 Knob Creek Dr Unit 7238351
- 0 Knob Creek Dr Unit 8379837
- 0 Knob Creek Dr Unit 3150873
- 0 Knob Creek Dr
- 1117 Knob Creek Dr
- 1161 Knob Creek Dr
- 1220 Mason Mill Rd
- 0 Powell Ct Unit 7490781
- 0 Powell Ct
- 1040 Knox Ridge
- 1270 Knob Creek Dr
- 1031 Knox Ridge