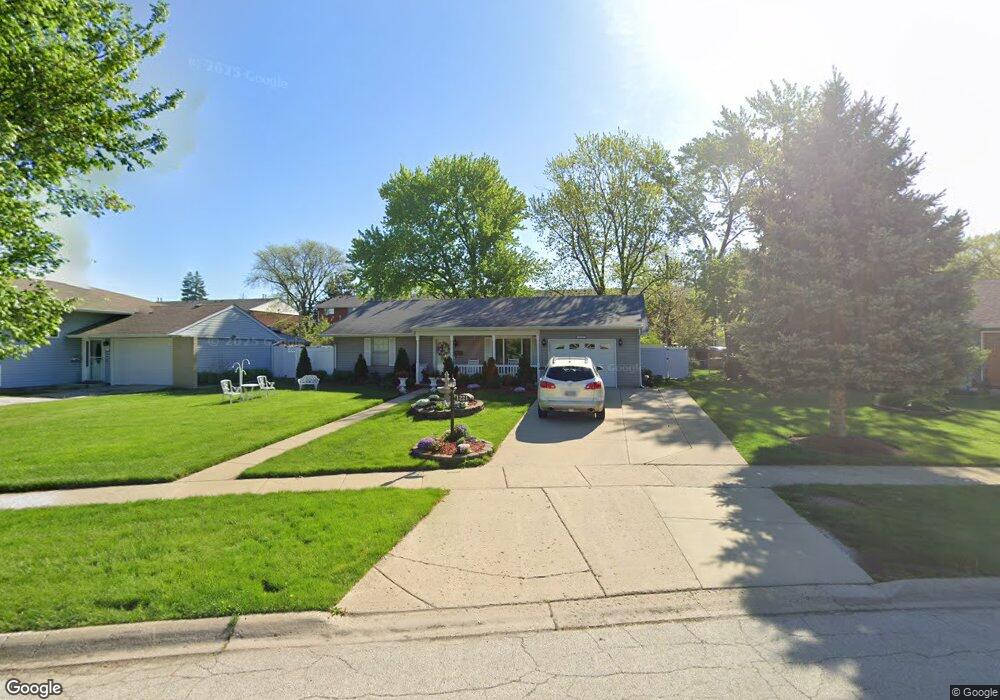
1221 Morton Ave Aurora, IL 60506
North River NeighborhoodEstimated Value: $268,000 - $297,000
3
Beds
1
Bath
1,213
Sq Ft
$229/Sq Ft
Est. Value
About This Home
This home is located at 1221 Morton Ave, Aurora, IL 60506 and is currently estimated at $278,181, approximately $229 per square foot. 1221 Morton Ave is a home located in Kane County with nearby schools including Smith Elementary School, Jewel Middle School, and West Aurora High School.
Ownership History
Date
Name
Owned For
Owner Type
Purchase Details
Closed on
Mar 17, 2004
Sold by
Micro Securities Inc
Bought by
Horton Amos H and Horton Betty
Current Estimated Value
Home Financials for this Owner
Home Financials are based on the most recent Mortgage that was taken out on this home.
Original Mortgage
$97,500
Outstanding Balance
$47,788
Interest Rate
6.37%
Mortgage Type
Unknown
Estimated Equity
$230,393
Purchase Details
Closed on
Sep 19, 2001
Sold by
Ellis Janice
Bought by
Streit Edward
Home Financials for this Owner
Home Financials are based on the most recent Mortgage that was taken out on this home.
Original Mortgage
$90,750
Interest Rate
6.99%
Purchase Details
Closed on
Sep 18, 2001
Sold by
Streit Edward F
Bought by
Micro Securities Inc
Home Financials for this Owner
Home Financials are based on the most recent Mortgage that was taken out on this home.
Original Mortgage
$90,750
Interest Rate
6.99%
Create a Home Valuation Report for This Property
The Home Valuation Report is an in-depth analysis detailing your home's value as well as a comparison with similar homes in the area
Home Values in the Area
Average Home Value in this Area
Purchase History
| Date | Buyer | Sale Price | Title Company |
|---|---|---|---|
| Horton Amos H | $132,000 | Law Title Insurance | |
| Streit Edward | $121,000 | 1St American Title | |
| Micro Securities Inc | -- | -- |
Source: Public Records
Mortgage History
| Date | Status | Borrower | Loan Amount |
|---|---|---|---|
| Open | Horton Amos H | $97,500 | |
| Previous Owner | Streit Edward | $90,750 |
Source: Public Records
Tax History Compared to Growth
Tax History
| Year | Tax Paid | Tax Assessment Tax Assessment Total Assessment is a certain percentage of the fair market value that is determined by local assessors to be the total taxable value of land and additions on the property. | Land | Improvement |
|---|---|---|---|---|
| 2024 | $4,894 | $77,814 | $15,912 | $61,902 |
| 2023 | $4,585 | $69,526 | $14,217 | $55,309 |
| 2022 | $4,642 | $63,436 | $12,972 | $50,464 |
| 2021 | $4,391 | $59,060 | $12,077 | $46,983 |
| 2020 | $4,672 | $60,909 | $11,218 | $49,691 |
| 2019 | $4,353 | $50,516 | $10,394 | $40,122 |
| 2018 | $4,072 | $46,794 | $9,614 | $37,180 |
| 2017 | $3,722 | $42,162 | $8,858 | $33,304 |
| 2016 | $3,578 | $39,684 | $7,593 | $32,091 |
| 2015 | -- | $34,486 | $6,529 | $27,957 |
| 2014 | -- | $33,167 | $6,279 | $26,888 |
| 2013 | -- | $33,677 | $6,190 | $27,487 |
Source: Public Records
Map
Nearby Homes
- 910 Southbridge Dr
- 1532 Golden Oaks Pkwy
- 795 N Elmwood Dr
- 781 N Elmwood Dr
- 461 Sullivan Rd
- 740 N Elmwood Dr
- 1104 New Haven Ave
- 1351 Monomoy St Unit D
- 1389 Monomoy St Unit B2
- 833 N Randall Rd Unit C4
- 1035 Newcastle Ln
- 616 Morton Ave
- 376 Florida Ave
- 1045 Palace St
- 972 Westgate Dr
- 602 N May St
- 3 Lovedale Ln
- 742 N Glenwood Place
- 526 N View St
- 809 W Park Ave
- 1231 Morton Ave
- 1211 Morton Ave Unit 1
- 1241 Durham Dr
- 1220 Morton Ave
- 1261 Durham Dr
- 1181 Morton Ave
- 870 Southbridge Dr Unit 1
- 1271 Durham Dr Unit 1
- 1250 Durham Dr
- 861 Southbridge Dr
- 825 Old Indian Trail
- 1180 Morton Ave
- 831 Old Indian Trail
- 815 Old Indian Trail
- 815 Old Indian Trail
- 880 Southbridge Dr
- 1270 Durham Dr
- 841 Old Indian Trail
- 830 Huntington Dr
- 1241 Post Rd