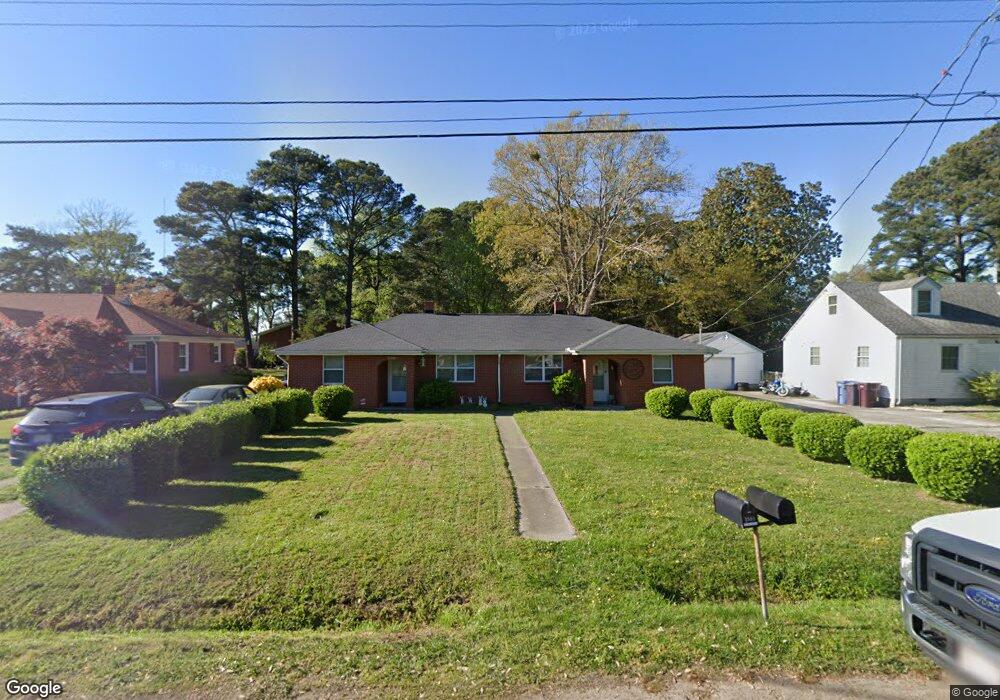
1221 Ormer Rd Chesapeake, VA 23325
Indian River NeighborhoodEstimated Value: $260,000 - $312,238
5
Beds
2
Baths
1,772
Sq Ft
$156/Sq Ft
Est. Value
About This Home
This home is located at 1221 Ormer Rd, Chesapeake, VA 23325 and is currently estimated at $275,810, approximately $155 per square foot. 1221 Ormer Rd is a home located in Chesapeake City with nearby schools including Norfolk Highlands Primary School, Sparrow Road Intermediate School, and Indian River Middle.
Ownership History
Date
Name
Owned For
Owner Type
Purchase Details
Closed on
Mar 26, 2021
Sold by
Maxson David R and Maxson Gail C
Bought by
Azar Leeann
Current Estimated Value
Purchase Details
Closed on
Mar 25, 2021
Sold by
Maxson David R and Maxson Gail C
Bought by
Azar Leeann
Purchase Details
Closed on
Mar 5, 2002
Sold by
Key Roy Lee
Bought by
Maxson David R
Home Financials for this Owner
Home Financials are based on the most recent Mortgage that was taken out on this home.
Original Mortgage
$77,440
Interest Rate
6.91%
Mortgage Type
Commercial
Create a Home Valuation Report for This Property
The Home Valuation Report is an in-depth analysis detailing your home's value as well as a comparison with similar homes in the area
Home Values in the Area
Average Home Value in this Area
Purchase History
| Date | Buyer | Sale Price | Title Company |
|---|---|---|---|
| Azar Leeann | $195,000 | Fidelity National Title | |
| Azar Leeann | $195,000 | Barristers Of Virginia | |
| Maxson David R | $97,000 | -- |
Source: Public Records
Mortgage History
| Date | Status | Borrower | Loan Amount |
|---|---|---|---|
| Previous Owner | Maxson David R | $77,440 |
Source: Public Records
Tax History
| Year | Tax Paid | Tax Assessment Tax Assessment Total Assessment is a certain percentage of the fair market value that is determined by local assessors to be the total taxable value of land and additions on the property. | Land | Improvement |
|---|---|---|---|---|
| 2025 | $2,653 | $287,300 | $115,000 | $172,300 |
| 2024 | $2,653 | $262,700 | $105,000 | $157,700 |
| 2023 | $2,177 | $236,200 | $95,000 | $141,200 |
| 2022 | $2,151 | $213,000 | $85,000 | $128,000 |
| 2021 | $2,018 | $192,200 | $75,000 | $117,200 |
| 2020 | $1,951 | $185,800 | $75,000 | $110,800 |
| 2019 | $1,931 | $183,900 | $75,000 | $108,900 |
| 2018 | $1,862 | $167,500 | $70,000 | $97,500 |
| 2017 | $1,768 | $168,400 | $70,000 | $98,400 |
| 2016 | $1,768 | $168,400 | $70,000 | $98,400 |
| 2015 | $1,768 | $168,400 | $70,000 | $98,400 |
| 2014 | $1,768 | $168,400 | $70,000 | $98,400 |
Source: Public Records
Map
Nearby Homes
Your Personal Tour Guide
Ask me questions while you tour the home.