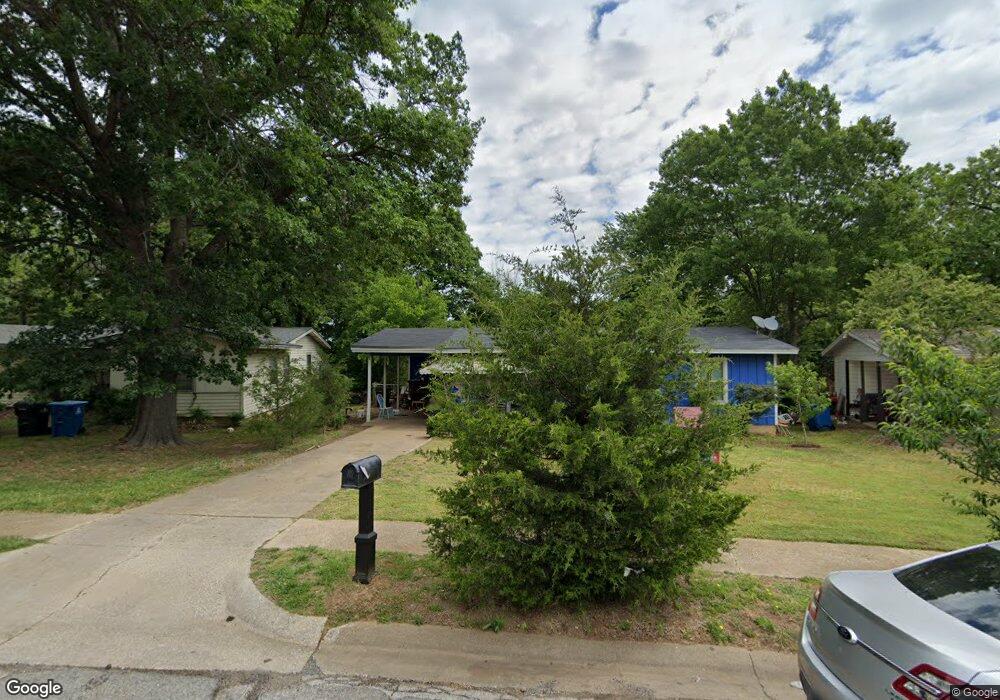
1221 Ridgewood Rd Denison, TX 75020
Estimated Value: $141,427 - $188,000
3
Beds
1
Bath
1,010
Sq Ft
$163/Sq Ft
Est. Value
About This Home
This home is located at 1221 Ridgewood Rd, Denison, TX 75020 and is currently estimated at $164,714, approximately $163 per square foot. 1221 Ridgewood Rd is a home located in Grayson County with nearby schools including Mayes Elementary School, Scott Middle School, and Denison High School.
Ownership History
Date
Name
Owned For
Owner Type
Purchase Details
Closed on
Feb 15, 2019
Sold by
Breitenbuecher Ed
Bought by
Banda Daniel and Rodriguez Maria
Current Estimated Value
Purchase Details
Closed on
Jun 4, 2015
Sold by
Ortiz Eustolio and Ortiz Maria D
Bought by
Rodriguez Gonzalo and Pationo Yolanda
Home Financials for this Owner
Home Financials are based on the most recent Mortgage that was taken out on this home.
Original Mortgage
$72,000
Interest Rate
3.68%
Mortgage Type
New Conventional
Purchase Details
Closed on
Oct 29, 2008
Sold by
Gertha L Sears Income Only Trust
Bought by
Ortiz Maria D and Ortiz Eustolio
Home Financials for this Owner
Home Financials are based on the most recent Mortgage that was taken out on this home.
Original Mortgage
$30,900
Interest Rate
5.83%
Mortgage Type
Purchase Money Mortgage
Purchase Details
Closed on
Feb 22, 2008
Sold by
Sears Gertha L and Wood Melba J
Bought by
Gertha L Sears Income Only Trust
Create a Home Valuation Report for This Property
The Home Valuation Report is an in-depth analysis detailing your home's value as well as a comparison with similar homes in the area
Home Values in the Area
Average Home Value in this Area
Purchase History
| Date | Buyer | Sale Price | Title Company |
|---|---|---|---|
| Banda Daniel | -- | None Available | |
| Rodriguez Gonzalo | -- | None Available | |
| Ortiz Maria D | -- | Red River Title Co | |
| Gertha L Sears Income Only Trust | -- | None Available |
Source: Public Records
Mortgage History
| Date | Status | Borrower | Loan Amount |
|---|---|---|---|
| Previous Owner | Rodriguez Gonzalo | $72,000 | |
| Previous Owner | Ortiz Maria D | $30,900 |
Source: Public Records
Tax History Compared to Growth
Tax History
| Year | Tax Paid | Tax Assessment Tax Assessment Total Assessment is a certain percentage of the fair market value that is determined by local assessors to be the total taxable value of land and additions on the property. | Land | Improvement |
|---|---|---|---|---|
| 2025 | $2,433 | $102,281 | $45,838 | $56,443 |
| 2024 | $2,433 | $104,732 | $49,075 | $55,657 |
| 2023 | $2,165 | $95,561 | $43,793 | $51,768 |
| 2022 | $2,158 | $90,839 | $43,793 | $47,046 |
| 2021 | $1,640 | $65,034 | $25,390 | $39,644 |
| 2020 | $1,492 | $56,553 | $16,018 | $40,535 |
| 2019 | $1,540 | $55,980 | $13,376 | $42,604 |
| 2018 | $1,361 | $49,053 | $8,861 | $40,192 |
| 2017 | $1,282 | $45,831 | $7,753 | $38,078 |
| 2016 | $1,298 | $46,404 | $7,498 | $38,906 |
| 2015 | $1,108 | $39,211 | $3,664 | $35,547 |
| 2014 | $1,007 | $35,656 | $3,664 | $31,992 |
Source: Public Records
Map
Nearby Homes
- 727 W Parnell St
- 916 Leeper Dr
- TBD - W Washington St
- 1505 W Johnson St
- 1721 W Walker St Unit A and B
- 1208 Martin Luther King St
- 00 Farm To Market 84
- 1601 W Bond St
- 1209 W Johnson St
- 2016 Macgregor Dr
- 2021 W Walker St
- 1915 W Bond St
- 1985 W Bond St
- 1981 W Bond St
- 3450 Juanita Dr
- 1905 W Morton St Unit 6
- 1905 W Morton St Unit 5
- 1905 W Morton St Unit 17
- 1905 W Morton St Unit 20
- 1905 W Morton St Unit 7
- 1225 Ridgewood Rd
- 1217 Ridgewood Rd
- 1701 Ridgewood Rd
- 1213 Ridgewood Rd
- 1216 Ridgewood Rd
- 1212 Ridgewood Rd
- 1209 Ridgewood Rd
- 1705 Ridgewood Rd
- 1700 Ridgewood Rd
- 1709 Ridgewood Rd
- 1205 Ridgewood Rd
- 1708 Ridgewood Rd
- 1701 Meadowlark Ln
- 1705 Meadowlark Ln
- 1713 Ridgewood Rd
- 1712 Ridgewood Rd
- 1201 Ridgewood Rd
- 1709 Meadowlark Ln
- 1717 Ridgewood Rd
- 1716 Ridgewood Rd