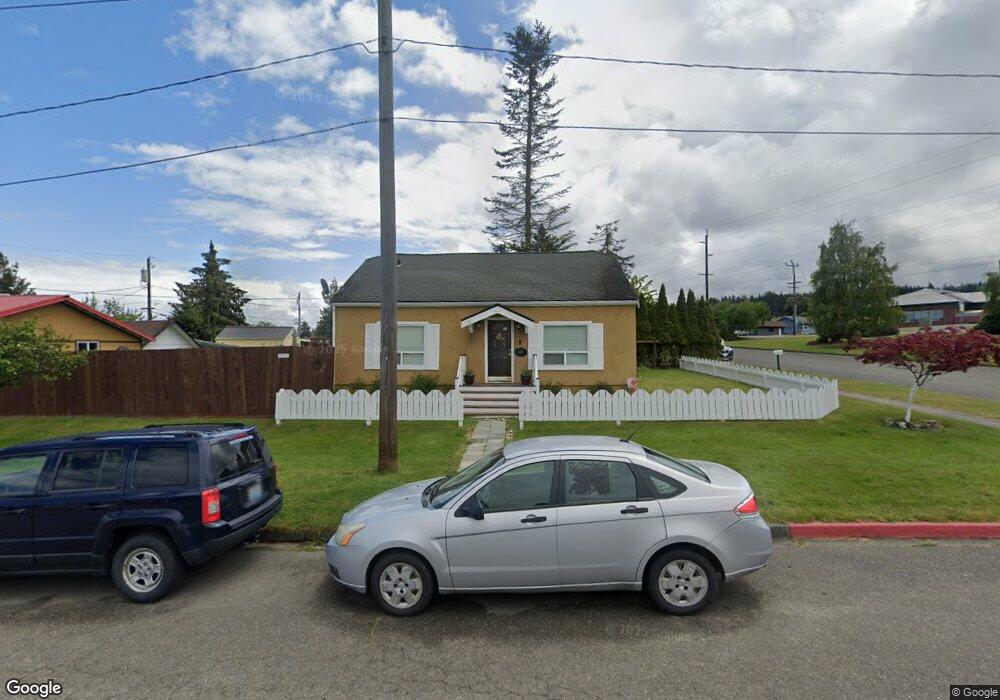
1221 S Chase St Port Angeles, WA 98362
Estimated Value: $339,000 - $367,000
4
Beds
1
Bath
1,404
Sq Ft
$253/Sq Ft
Est. Value
About This Home
This home is located at 1221 S Chase St, Port Angeles, WA 98362 and is currently estimated at $354,545, approximately $252 per square foot. 1221 S Chase St is a home located in Clallam County with nearby schools including Jefferson Elementary School, Stevens Middle School, and Port Angeles High School.
Ownership History
Date
Name
Owned For
Owner Type
Purchase Details
Closed on
Apr 26, 2011
Sold by
Jpmorgan Chase Bank Na
Bought by
Shaffar Jeffrey H and Shaffar Maria A
Current Estimated Value
Home Financials for this Owner
Home Financials are based on the most recent Mortgage that was taken out on this home.
Original Mortgage
$85,000
Outstanding Balance
$5,187
Interest Rate
4.72%
Mortgage Type
VA
Estimated Equity
$349,358
Purchase Details
Closed on
Sep 16, 2010
Sold by
Rigg John R and Rigg Linda D
Bought by
Jpmorgan Chase Bank Na
Create a Home Valuation Report for This Property
The Home Valuation Report is an in-depth analysis detailing your home's value as well as a comparison with similar homes in the area
Home Values in the Area
Average Home Value in this Area
Purchase History
| Date | Buyer | Sale Price | Title Company |
|---|---|---|---|
| Shaffar Jeffrey H | $85,000 | Land Title & Escrow Co Of Cl | |
| Jpmorgan Chase Bank Na | $139,895 | Olympic Peninsula Title Co |
Source: Public Records
Mortgage History
| Date | Status | Borrower | Loan Amount |
|---|---|---|---|
| Open | Shaffar Jeffrey H | $85,000 |
Source: Public Records
Tax History Compared to Growth
Tax History
| Year | Tax Paid | Tax Assessment Tax Assessment Total Assessment is a certain percentage of the fair market value that is determined by local assessors to be the total taxable value of land and additions on the property. | Land | Improvement |
|---|---|---|---|---|
| 2021 | $2,474 | $193,942 | $50,000 | $143,942 |
| 2020 | $1,984 | $186,560 | $50,000 | $136,560 |
| 2018 | $1,933 | $164,025 | $50,000 | $114,025 |
| 2017 | $1,586 | $137,819 | $50,000 | $87,819 |
| 2016 | $1,586 | $138,484 | $50,000 | $88,484 |
| 2015 | $1,586 | $127,984 | $50,000 | $77,984 |
| 2013 | $1,586 | $109,592 | $50,000 | $59,592 |
| 2012 | $1,586 | $135,565 | $53,125 | $82,440 |
Source: Public Records
Map
Nearby Homes