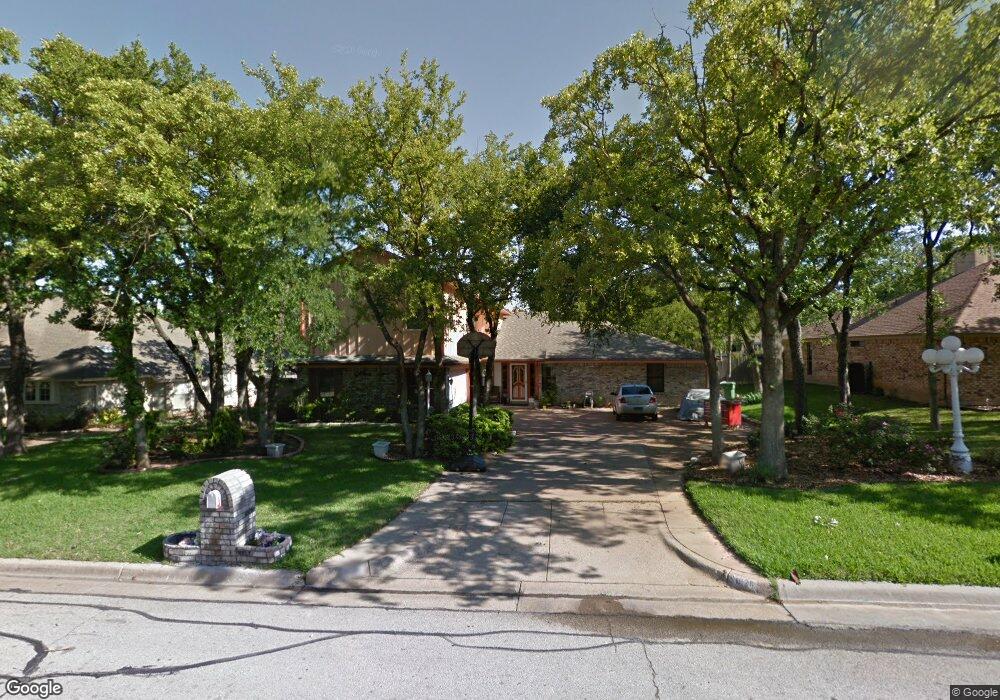
1221 Shirley Way Bedford, TX 76022
Estimated Value: $445,000 - $512,839
3
Beds
2
Baths
3,084
Sq Ft
$156/Sq Ft
Est. Value
About This Home
This home is located at 1221 Shirley Way, Bedford, TX 76022 and is currently estimated at $481,460, approximately $156 per square foot. 1221 Shirley Way is a home located in Tarrant County with nearby schools including Stonegate Elementary School, Central J High School, and L.D. Bell High School.
Ownership History
Date
Name
Owned For
Owner Type
Purchase Details
Closed on
Jan 13, 2022
Sold by
Sylvia Thornton
Bought by
Thornton Sylvia
Current Estimated Value
Create a Home Valuation Report for This Property
The Home Valuation Report is an in-depth analysis detailing your home's value as well as a comparison with similar homes in the area
Home Values in the Area
Average Home Value in this Area
Purchase History
| Date | Buyer | Sale Price | Title Company |
|---|---|---|---|
| Thornton Sylvia | -- | None Listed On Document |
Source: Public Records
Tax History Compared to Growth
Tax History
| Year | Tax Paid | Tax Assessment Tax Assessment Total Assessment is a certain percentage of the fair market value that is determined by local assessors to be the total taxable value of land and additions on the property. | Land | Improvement |
|---|---|---|---|---|
| 2025 | $6,203 | $469,012 | $75,000 | $394,012 |
| 2024 | $6,203 | $469,012 | $75,000 | $394,012 |
| 2023 | $8,833 | $495,269 | $55,000 | $440,269 |
| 2022 | $9,144 | $428,880 | $55,000 | $373,880 |
| 2021 | $8,966 | $397,568 | $55,000 | $342,568 |
| 2020 | $8,227 | $346,012 | $55,000 | $291,012 |
| 2019 | $8,459 | $348,179 | $55,000 | $293,179 |
| 2018 | $7,370 | $319,095 | $35,000 | $284,095 |
| 2017 | $7,696 | $326,560 | $35,000 | $291,560 |
| 2016 | $6,997 | $299,846 | $35,000 | $264,846 |
| 2015 | $5,728 | $272,878 | $35,000 | $237,878 |
| 2014 | $5,728 | $244,100 | $28,000 | $216,100 |
Source: Public Records
Map
Nearby Homes
- 1213 Briar Dr
- 1204 Edgecliff Dr
- 1509 Shirley Way
- 1416 Wade Dr
- 604 Donna Ln
- 1004 Overhill Dr
- 1108 Wade Dr
- 49 Coffee Tavern Rd
- 345 Somerset Cir
- 501 Merrill Dr
- 258 Somerset Terrace
- 921 Overhill Dr
- 1236 King Dr
- 1031 Boston Blvd
- 909 Overhill Dr
- 140 Stonegate Ct
- 933 Wade Dr
- 6 Park Ln
- 18 Park Ln
- 93 Regents Park
- 1217 Shirley Way
- 1225 Shirley Way
- 1316 Circle Ln
- 1312 Circle Ln
- 1320 Circle Ln
- 1213 Shirley Way
- 1216 Shirley Way
- 1212 Shirley Way
- 1220 Shirley Way
- 1301 Shirley Way
- 1308 Circle Ln
- 1208 Shirley Way
- 1300 Shirley Way
- 1324 Circle Ln
- 1209 Shirley Way
- 1204 Shirley Way
- 1304 Circle Ln
- 1304 Shirley Way
- 1305 Circle Ln
- 1309 Circle Ln