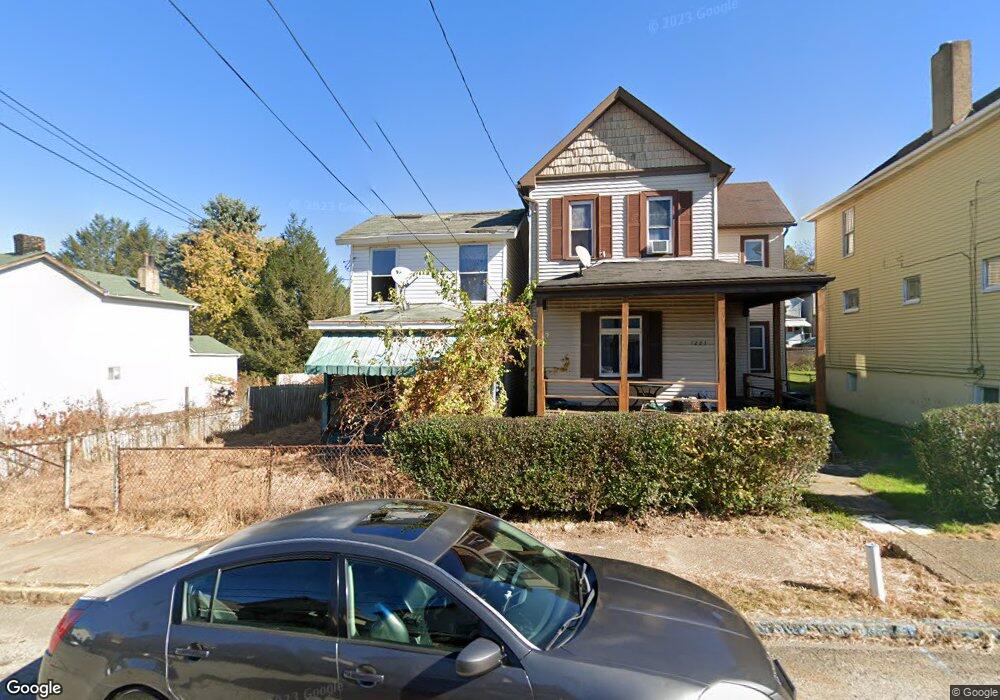
1221 Soles St McKeesport, PA 15132
Estimated Value: $46,098 - $121,000
3
Beds
2
Baths
1,506
Sq Ft
$50/Sq Ft
Est. Value
About This Home
This home is located at 1221 Soles St, McKeesport, PA 15132 and is currently estimated at $76,025, approximately $50 per square foot. 1221 Soles St is a home located in Allegheny County with nearby schools including Mckeesport Area Senior High School, Propel Schools - McKeesport, and Mary of Nazareth Catholic School.
Ownership History
Date
Name
Owned For
Owner Type
Purchase Details
Closed on
Oct 3, 2023
Sold by
Ibuy Distressed Homes L L C
Bought by
Caguana Luis Antonio Cela
Current Estimated Value
Purchase Details
Closed on
Oct 2, 2023
Sold by
I Buy Distressed Homes Llc
Bought by
Cela Caguana Luis Antonio
Purchase Details
Closed on
Aug 9, 2021
Sold by
Read Inc
Bought by
I Buy Distressed Homes Llc
Purchase Details
Closed on
Mar 12, 1996
Sold by
Honick George K and Richards Nancy L
Bought by
Read Inc
Purchase Details
Closed on
Aug 4, 1995
Sold by
Burkett Gerald E
Bought by
Honick George E and Richards Nancy L
Create a Home Valuation Report for This Property
The Home Valuation Report is an in-depth analysis detailing your home's value as well as a comparison with similar homes in the area
Home Values in the Area
Average Home Value in this Area
Purchase History
| Date | Buyer | Sale Price | Title Company |
|---|---|---|---|
| Cela Caguana Luis Antonio | $1,000 | -- | |
| Cela Caguana Luis Antonio | $1,000 | -- | |
| I Buy Distressed Homes Llc | $2,000 | -- | |
| I Buy Distressed Homes L L C | $2,000 | None Available | |
| Read Inc | $12,000 | -- | |
| Honick George E | $7,000 | -- | |
| Caguana Luis Antonio Cela | $1,000 | -- |
Source: Public Records
Tax History Compared to Growth
Tax History
| Year | Tax Paid | Tax Assessment Tax Assessment Total Assessment is a certain percentage of the fair market value that is determined by local assessors to be the total taxable value of land and additions on the property. | Land | Improvement |
|---|---|---|---|---|
| 2025 | $476 | $10,300 | $4,000 | $6,300 |
| 2024 | $476 | $10,300 | $4,000 | $6,300 |
| 2023 | $476 | $10,300 | $4,000 | $6,300 |
| 2022 | $476 | $10,300 | $4,000 | $6,300 |
| 2021 | $49 | $10,300 | $4,000 | $6,300 |
| 2020 | $468 | $10,300 | $4,000 | $6,300 |
| 2019 | $314 | $10,300 | $4,000 | $6,300 |
| 2018 | $49 | $10,300 | $4,000 | $6,300 |
| 2017 | $286 | $10,300 | $4,000 | $6,300 |
| 2016 | $49 | $10,300 | $4,000 | $6,300 |
| 2015 | $49 | $10,300 | $4,000 | $6,300 |
| 2014 | $210 | $10,300 | $4,000 | $6,300 |
Source: Public Records
Map
Nearby Homes