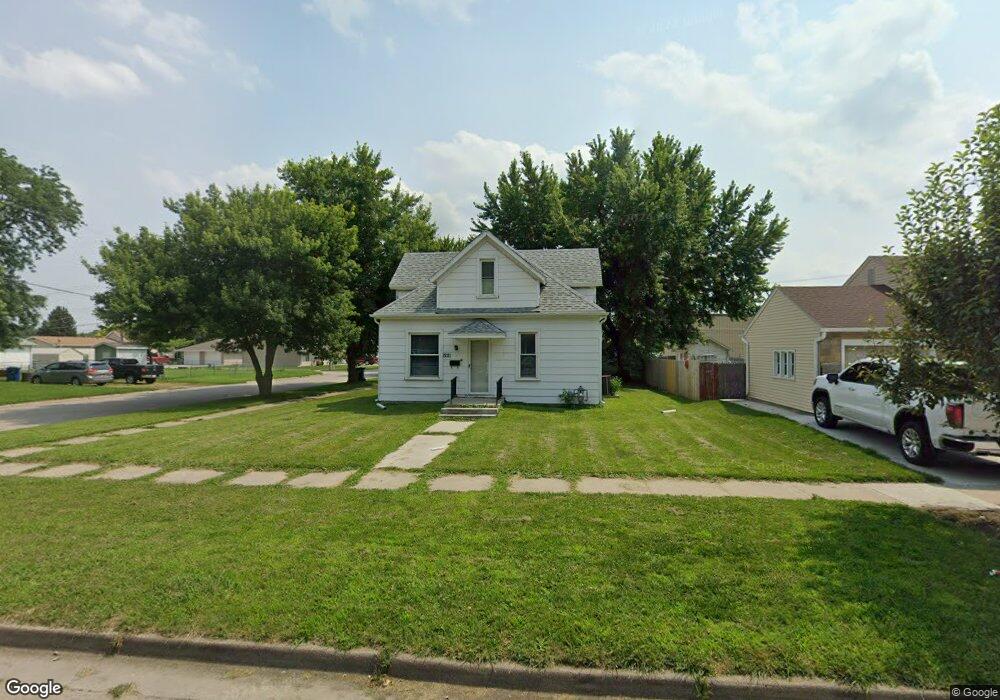
1221 Taylor Ave Norfolk, NE 68701
Estimated Value: $166,000 - $210,000
2
Beds
1
Bath
1,192
Sq Ft
$156/Sq Ft
Est. Value
About This Home
This home is located at 1221 Taylor Ave, Norfolk, NE 68701 and is currently estimated at $186,283, approximately $156 per square foot. 1221 Taylor Ave is a home located in Madison County with nearby schools including Norfolk Senior High School, Christ Lutheran School, and Keystone Christian Academy.
Ownership History
Date
Name
Owned For
Owner Type
Purchase Details
Closed on
May 4, 2020
Sold by
Schlomer John R and Schlomer Janice A
Bought by
Jns Properties Llc
Current Estimated Value
Home Financials for this Owner
Home Financials are based on the most recent Mortgage that was taken out on this home.
Original Mortgage
$79,277
Outstanding Balance
$38,623
Interest Rate
3%
Mortgage Type
Seller Take Back
Estimated Equity
$147,660
Purchase Details
Closed on
Oct 8, 2008
Sold by
Mcgann Chris and Mcgann Jan
Bought by
Schlomer John R and Schlomer Janice A
Purchase Details
Closed on
Oct 7, 2008
Sold by
Mcgann Chris and Mcgann Jan
Bought by
Schlomer John R and Schlomer Janice A
Purchase Details
Closed on
Oct 11, 2005
Sold by
Hake Brian L
Bought by
Mcgann Chris and Mcgann Jan
Purchase Details
Closed on
Sep 21, 2005
Sold by
Hake Brian L
Bought by
Mcgann Chris and Mcgann Jan
Create a Home Valuation Report for This Property
The Home Valuation Report is an in-depth analysis detailing your home's value as well as a comparison with similar homes in the area
Home Values in the Area
Average Home Value in this Area
Purchase History
| Date | Buyer | Sale Price | Title Company |
|---|---|---|---|
| Jns Properties Llc | $100,000 | Stewart Title Company | |
| Schlomer John R | $62,000 | -- | |
| Schlomer John R | $62,000 | Rels Title | |
| Mcgann Chris | $74,000 | -- | |
| Mcgann Chris | $74,000 | Rels Title |
Source: Public Records
Mortgage History
| Date | Status | Borrower | Loan Amount |
|---|---|---|---|
| Open | Jns Properties Llc | $79,277 |
Source: Public Records
Tax History Compared to Growth
Tax History
| Year | Tax Paid | Tax Assessment Tax Assessment Total Assessment is a certain percentage of the fair market value that is determined by local assessors to be the total taxable value of land and additions on the property. | Land | Improvement |
|---|---|---|---|---|
| 2024 | $2,123 | $171,016 | $11,934 | $159,082 |
| 2023 | $2,919 | $157,881 | $11,934 | $145,947 |
| 2022 | $2,637 | $142,244 | $11,934 | $130,310 |
| 2021 | $2,433 | $131,484 | $11,934 | $119,550 |
| 2020 | $2,243 | $121,613 | $11,934 | $109,679 |
| 2019 | $2,098 | $109,862 | $11,934 | $97,928 |
| 2018 | $1,822 | $96,983 | $9,547 | $87,436 |
| 2017 | $1,648 | $87,615 | $9,547 | $78,068 |
| 2016 | $1,529 | $81,125 | $8,840 | $72,285 |
| 2015 | $1,529 | $81,125 | $8,840 | $72,285 |
| 2014 | $1,508 | $77,683 | $8,840 | $68,843 |
| 2013 | $1,466 | $73,179 | $8,840 | $64,339 |
Source: Public Records
Map
Nearby Homes
- 706 Columbia St
- 404 S 12th St
- 602 S 10th St
- 1312 Hayes Ave
- 1313 W Park Ave
- 103 S 13th Place
- 809 S 14th St
- 705 S 10th St
- 1208 W Phillip Ave
- 3307 W Michigan Ave
- 3206 W Michigan Ave
- 3205 W Michigan Ave
- 3306 W Michigan Ave
- 2300 Taylor Ave
- 2308 Taylor Ave
- See Legal
- 213 S 9th St
- 1104 Southern Dr
- 3302 Stonebrooke Ln
- 1200 Prime Stop Way
- 1223 Taylor Ave
- 1225 Taylor Ave
- 608 Columbia St
- 1215 Taylor Ave
- 1227 Taylor Ave
- 1213 Taylor Ave
- 1226 W Pasewalk Ave
- 609 Columbia St
- 1220 Taylor Ave
- 610 Columbia St
- 1222 Taylor Ave
- 1211 Taylor Ave
- 1224 W Pasewalk Ave
- 1229 Taylor Ave
- 1228 W Pasewalk Ave
- 1224 Taylor Ave
- Busines Only
- 1209 Taylor Ave
- 1212 W Pasewalk Ave
- 1226 Taylor Ave