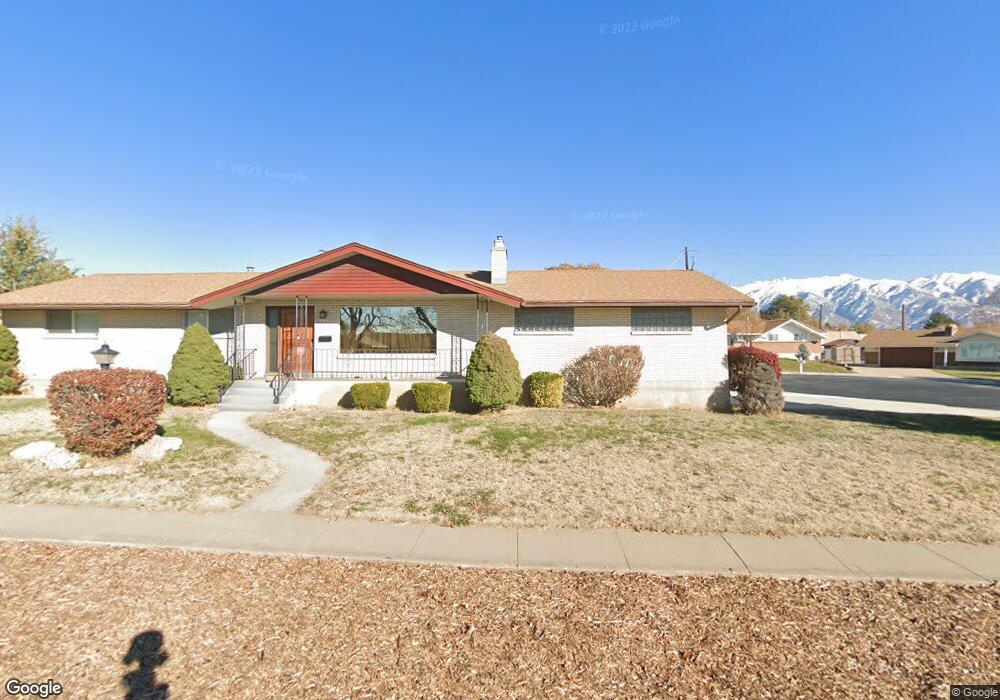
1221 Valhalla Dr Clearfield, UT 84015
Estimated Value: $480,000 - $485,000
6
Beds
3
Baths
2,774
Sq Ft
$174/Sq Ft
Est. Value
About This Home
This home is located at 1221 Valhalla Dr, Clearfield, UT 84015 and is currently estimated at $482,060, approximately $173 per square foot. 1221 Valhalla Dr is a home located in Davis County with nearby schools including South Clearfield Elementary School, North Davis Junior High School, and Clearfield High School.
Ownership History
Date
Name
Owned For
Owner Type
Purchase Details
Closed on
May 8, 2019
Sold by
Talbot Breeanne M and Talbot Cody J
Bought by
Coons Susan Gaye and Coons Leonard E
Current Estimated Value
Home Financials for this Owner
Home Financials are based on the most recent Mortgage that was taken out on this home.
Original Mortgage
$289,165
Outstanding Balance
$253,970
Interest Rate
4.25%
Mortgage Type
FHA
Estimated Equity
$228,090
Purchase Details
Closed on
Jan 4, 2018
Sold by
Jurek Karl J
Bought by
Talbot Breanne M and Talbot Cody J
Purchase Details
Closed on
Sep 11, 2009
Sold by
Jurek Louise
Bought by
Jurek Karl J and Louise Jurek Irrevocable Trust
Create a Home Valuation Report for This Property
The Home Valuation Report is an in-depth analysis detailing your home's value as well as a comparison with similar homes in the area
Home Values in the Area
Average Home Value in this Area
Purchase History
| Date | Buyer | Sale Price | Title Company |
|---|---|---|---|
| Coons Susan Gaye | -- | Us Title Company | |
| Talbot Breanne M | -- | Us Title | |
| Jurek Karl J | -- | None Available |
Source: Public Records
Mortgage History
| Date | Status | Borrower | Loan Amount |
|---|---|---|---|
| Open | Coons Susan Gaye | $289,165 |
Source: Public Records
Tax History
| Year | Tax Paid | Tax Assessment Tax Assessment Total Assessment is a certain percentage of the fair market value that is determined by local assessors to be the total taxable value of land and additions on the property. | Land | Improvement |
|---|---|---|---|---|
| 2025 | $2,713 | $243,100 | $89,774 | $153,326 |
| 2024 | $2,620 | $236,500 | $85,719 | $150,781 |
| 2023 | $2,372 | $393,000 | $135,688 | $257,312 |
| 2022 | $2,516 | $225,500 | $76,411 | $149,089 |
| 2021 | $2,267 | $307,000 | $88,842 | $218,158 |
| 2020 | $1,986 | $267,000 | $76,227 | $190,773 |
| 2019 | $1,974 | $262,000 | $74,444 | $187,556 |
| 2018 | $1,817 | $235,000 | $62,773 | $172,227 |
| 2016 | $289 | $107,140 | $26,909 | $80,231 |
| 2015 | $1,444 | $93,060 | $26,909 | $66,151 |
| 2014 | $1,357 | $88,637 | $26,909 | $61,728 |
| 2013 | -- | $100,650 | $34,975 | $65,675 |
Source: Public Records
Map
Nearby Homes
- 1520 E 1100 S
- 911 S 1500 E
- 1127 E 1050 S
- 1612 E 925 S
- 1021 E 1225 S Unit A
- 1560 E 800 S Unit C
- 1543 E 750 S Unit C5
- 870 S 1625 E Unit A
- 865 S 1650 E Unit A
- 876 S 1000 E
- 897 E 1000 S
- 1644 E 700 S
- 842 E 1000 S
- 732 E 1000 S
- 1648 W 1920 N
- 2931 N 1175 W
- 2896 N 1175 W
- 1916 N Celia Way
- 1883 W 1575 N
- 1888 W 1575 N Unit 235
- 1223 Valhalla Dr
- 1219 Valhalla Dr
- 1215 Valhalla Dr
- 1217 Valhalla Dr
- 1225 Valhalla Dr
- 1227 Valhalla Dr
- 1213 Valhalla Dr
- 1231 Valhalla Dr
- 1224 Valhalla Dr
- 1220 Valhalla Dr
- 1216 Valhalla Dr
- 1229 Valhalla Dr
- 1211 Valhalla Dr
- 1226 Valhalla Dr
- 1214 Valhalla Dr
- 1233 Valhalla Dr
- 1212 Valhalla Dr
- 1228 Valhalla Dr
- 1217 E 1100 S
- 1209 E 1100 S
Your Personal Tour Guide
Ask me questions while you tour the home.