Estimated Value: $260,000 - $306,000
4
Beds
3
Baths
2,033
Sq Ft
$138/Sq Ft
Est. Value
About This Home
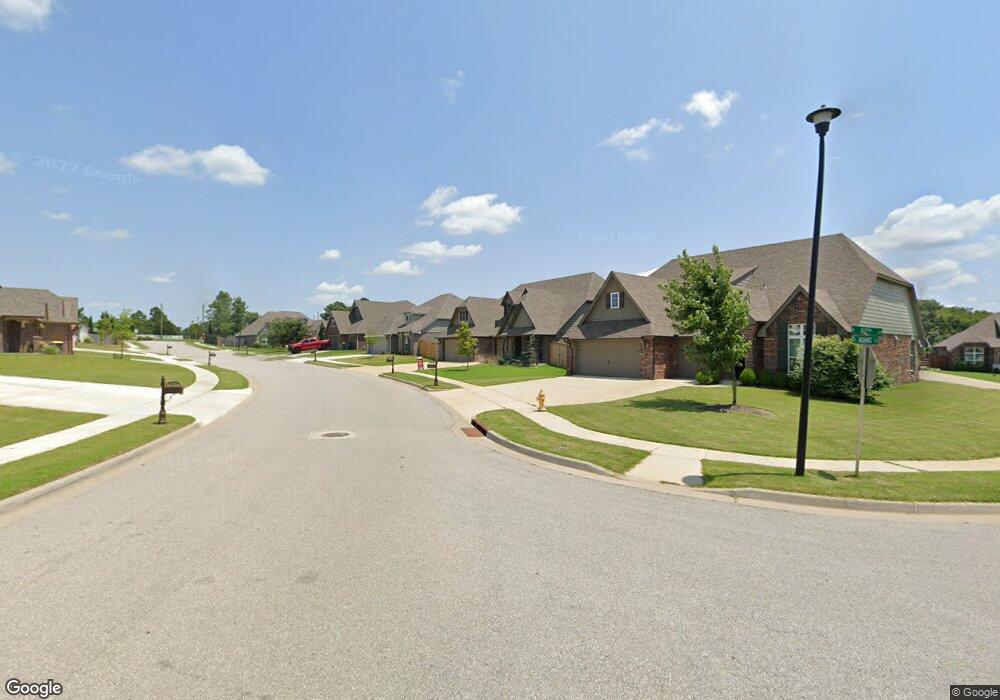
This home is located at 1221 W 112th St S, Jenks, OK 74037 and is currently estimated at $281,360, approximately $138 per square foot. 1221 W 112th St S is a home located in Tulsa County with nearby schools including Jenks West Elementary School, Jenks West Intermediate Elementary School, and Jenks Middle School.
Ownership History
Date
Name
Owned For
Owner Type
Purchase Details
Closed on
Apr 25, 2007
Sold by
Core Mark S and Core Lora L
Bought by
Jackson Ryan
Current Estimated Value
Home Financials for this Owner
Home Financials are based on the most recent Mortgage that was taken out on this home.
Original Mortgage
$154,900
Outstanding Balance
$93,399
Interest Rate
6.1%
Mortgage Type
Purchase Money Mortgage
Estimated Equity
$187,961
Purchase Details
Closed on
Mar 24, 1999
Sold by
Shaw Douglas W and Shaw Susan L
Bought by
Core Mark S and Core Lora L
Purchase Details
Closed on
Apr 30, 1998
Sold by
Washko Jonathan D and Washko Debra E
Bought by
Shaw Douglas W and Shaw Susan L
Home Financials for this Owner
Home Financials are based on the most recent Mortgage that was taken out on this home.
Original Mortgage
$113,905
Interest Rate
7.09%
Mortgage Type
Purchase Money Mortgage
Create a Home Valuation Report for This Property
The Home Valuation Report is an in-depth analysis detailing your home's value as well as a comparison with similar homes in the area
Home Values in the Area
Average Home Value in this Area
Purchase History
| Date | Buyer | Sale Price | Title Company |
|---|---|---|---|
| Jackson Ryan | $155,000 | Firstitle & Abstract Service | |
| Core Mark S | $125,000 | First Amer Title & Abstract | |
| Shaw Douglas W | $120,000 | Metro Title Co |
Source: Public Records
Mortgage History
| Date | Status | Borrower | Loan Amount |
|---|---|---|---|
| Open | Jackson Ryan | $154,900 | |
| Previous Owner | Shaw Douglas W | $113,905 |
Source: Public Records
Tax History Compared to Growth
Tax History
| Year | Tax Paid | Tax Assessment Tax Assessment Total Assessment is a certain percentage of the fair market value that is determined by local assessors to be the total taxable value of land and additions on the property. | Land | Improvement |
|---|---|---|---|---|
| 2024 | $2,176 | $17,631 | $1,761 | $15,870 |
| 2023 | $2,176 | $18,088 | $1,862 | $16,226 |
| 2022 | $2,129 | $16,561 | $2,147 | $14,414 |
| 2021 | $2,090 | $16,050 | $2,081 | $13,969 |
| 2020 | $2,044 | $16,050 | $2,081 | $13,969 |
| 2019 | $2,058 | $16,050 | $2,081 | $13,969 |
| 2018 | $2,072 | $16,050 | $2,081 | $13,969 |
| 2017 | $2,038 | $17,050 | $2,211 | $14,839 |
| 2016 | $2,088 | $17,050 | $2,211 | $14,839 |
| 2015 | $2,128 | $17,050 | $2,211 | $14,839 |
| 2014 | $2,176 | $17,050 | $2,211 | $14,839 |
Source: Public Records
Map
Nearby Homes
- 1226 W 109th Place S
- 110 W 113th St S
- 10906 S Mulberry Ave
- 1623 W 114th St
- 11515 S Mulberry Ct
- 11224 S Fir Ave
- 11264 S Fir Ave
- 11312 S Fir Ave
- 11308 S Fir Ave
- 11260 S Fir Ave
- 1116 W 108th Place S
- 10821 S Fir St
- 11265 S Fir Ave
- 11261 S Fir Ave
- 1615 W 115th Place
- 1113 W 108th Place S
- 11527 S Nandina Place
- 691 W 113th Ct S
- 12004 S Nandina Ave
- 10715 S Elgin
- 1217 W 112th St S
- 1213 W 112th St S
- 1228 W 112th Dr S
- 1222 W 112th Dr S
- 1229 W 112th St S
- 1216 W 112th Dr S
- 1236 W 112th St S
- 1209 W 112th St S
- 11202 S Locust Ave
- 1212 W 112th Dr S
- 1205 W 112th St S
- 1237 W 112th St S
- 1201 W 112th St S
- 1242 W 112th Dr S
- 1206 W 112th Dr S
- 1202 W 112th St S
- 1234 W 112th St S
- 11224 S Locust Ave
- 1248 W 112th Dr S
- 1221 W 112th Dr S