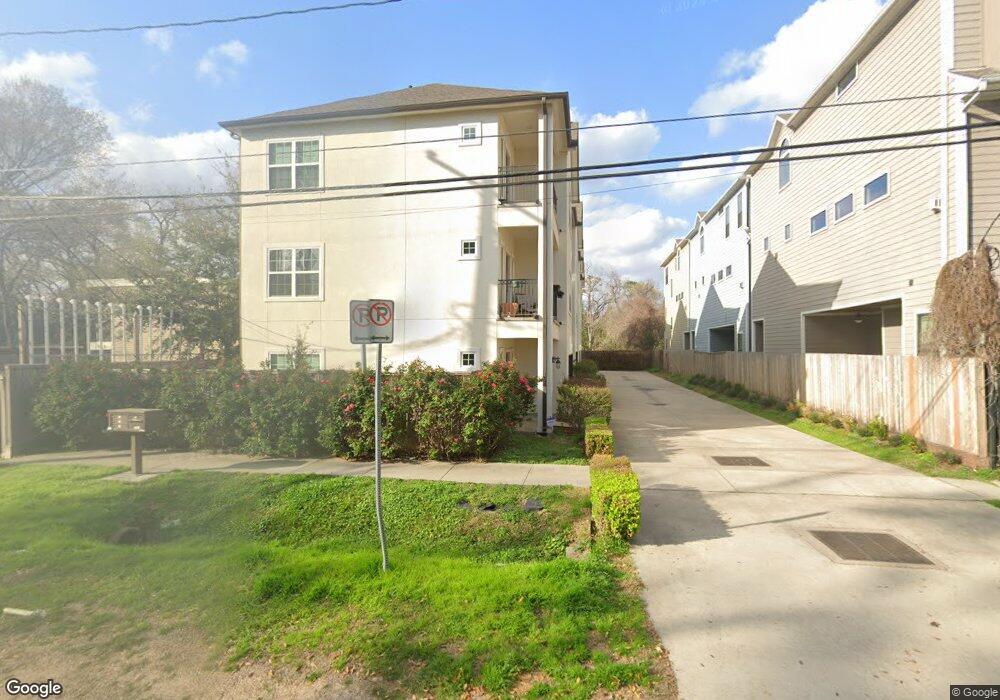
1221 W 25th St Unit A Houston, TX 77008
Greater Heights NeighborhoodEstimated Value: $490,546 - $536,000
3
Beds
4
Baths
2,170
Sq Ft
$237/Sq Ft
Est. Value
About This Home
This home is located at 1221 W 25th St Unit A, Houston, TX 77008 and is currently estimated at $513,387, approximately $236 per square foot. 1221 W 25th St Unit A is a home located in Harris County with nearby schools including Sinclair Elementary School, Hamilton Middle, and Waltrip High School.
Ownership History
Date
Name
Owned For
Owner Type
Purchase Details
Closed on
May 26, 2021
Sold by
Johnson Edward D
Bought by
Fang Shiyu
Current Estimated Value
Home Financials for this Owner
Home Financials are based on the most recent Mortgage that was taken out on this home.
Original Mortgage
$336,000
Outstanding Balance
$304,024
Interest Rate
3%
Mortgage Type
New Conventional
Estimated Equity
$209,363
Purchase Details
Closed on
May 14, 2018
Sold by
Mccullough Jason P and Hurst Ann Elysa
Bought by
Johnson Edward B
Home Financials for this Owner
Home Financials are based on the most recent Mortgage that was taken out on this home.
Original Mortgage
$384,750
Interest Rate
4.44%
Mortgage Type
New Conventional
Purchase Details
Closed on
Oct 9, 2015
Sold by
Infinite Group Development Llc
Bought by
Mccullough Jason P
Home Financials for this Owner
Home Financials are based on the most recent Mortgage that was taken out on this home.
Original Mortgage
$287,200
Interest Rate
3.93%
Mortgage Type
New Conventional
Create a Home Valuation Report for This Property
The Home Valuation Report is an in-depth analysis detailing your home's value as well as a comparison with similar homes in the area
Home Values in the Area
Average Home Value in this Area
Purchase History
| Date | Buyer | Sale Price | Title Company |
|---|---|---|---|
| Fang Shiyu | -- | Capital Title | |
| Johnson Edward B | -- | Fidelity National Title | |
| Mccullough Jason P | -- | None Available |
Source: Public Records
Mortgage History
| Date | Status | Borrower | Loan Amount |
|---|---|---|---|
| Open | Fang Shiyu | $336,000 | |
| Previous Owner | Johnson Edward B | $384,750 | |
| Previous Owner | Mccullough Jason P | $287,200 |
Source: Public Records
Tax History Compared to Growth
Tax History
| Year | Tax Paid | Tax Assessment Tax Assessment Total Assessment is a certain percentage of the fair market value that is determined by local assessors to be the total taxable value of land and additions on the property. | Land | Improvement |
|---|---|---|---|---|
| 2025 | $7,128 | $488,069 | $168,560 | $319,509 |
| 2024 | $7,128 | $476,897 | $168,560 | $308,337 |
| 2023 | $7,128 | $463,948 | $132,440 | $331,508 |
| 2022 | $9,262 | $420,654 | $108,360 | $312,294 |
| 2021 | $8,974 | $385,042 | $108,360 | $276,682 |
| 2020 | $9,011 | $372,127 | $111,611 | $260,516 |
| 2019 | $9,380 | $370,692 | $111,611 | $259,081 |
| 2018 | $7,240 | $370,692 | $111,611 | $259,081 |
| 2017 | $9,373 | $370,692 | $111,611 | $259,081 |
| 2016 | $9,373 | $370,692 | $111,611 | $259,081 |
| 2015 | -- | $0 | $0 | $0 |
Source: Public Records
Map
Nearby Homes
- 1235 W 25th St
- 1230 W 26th St
- 1240 W 26th St
- 1207 W 24th St Unit A
- 2416 Bevis St
- 2426 Bevis St
- 1138 W 25th St Unit F
- 1128 W 26th St
- 2623 Shady Woods Ln
- 1135 W 26th St Unit 5
- 1137 W 26th St
- 1241 W 24th St Unit C
- 1135 W 24th St Unit A
- 2543 Bevis St
- 1219 Creekside Acres Ct
- 1114 W 25th St
- 1114 Beall Landing Ct
- 1121 Beall Landing Ct
- 2308 Bevis St
- 2609 Bevis St
- 1221 W 25th St
- 1221 W 25th St Unit B
- 1221 W 25th St Unit C
- 1221 W 25th St Unit A
- 1221 W 25th St Unit D
- 1223 W 25th St Unit 7
- 1223 W 25th St Unit 3
- 1223 W 25th St Unit 1
- 1223 W 25th St Unit 2
- 1223 W 25th St Unit 4
- 1219 25th C
- 1225 W 25th St
- 1225 W 25th St
- 1225 W 25th St Unit 12
- 1225 W 25th St Unit 4
- 1225 W 25th St Unit 2
- 1225 W 25th St Unit 1
- 1225 W 25th St Unit 6
- 1225 W 25th St Unit 8
- 1225 W 25th St Unit 3