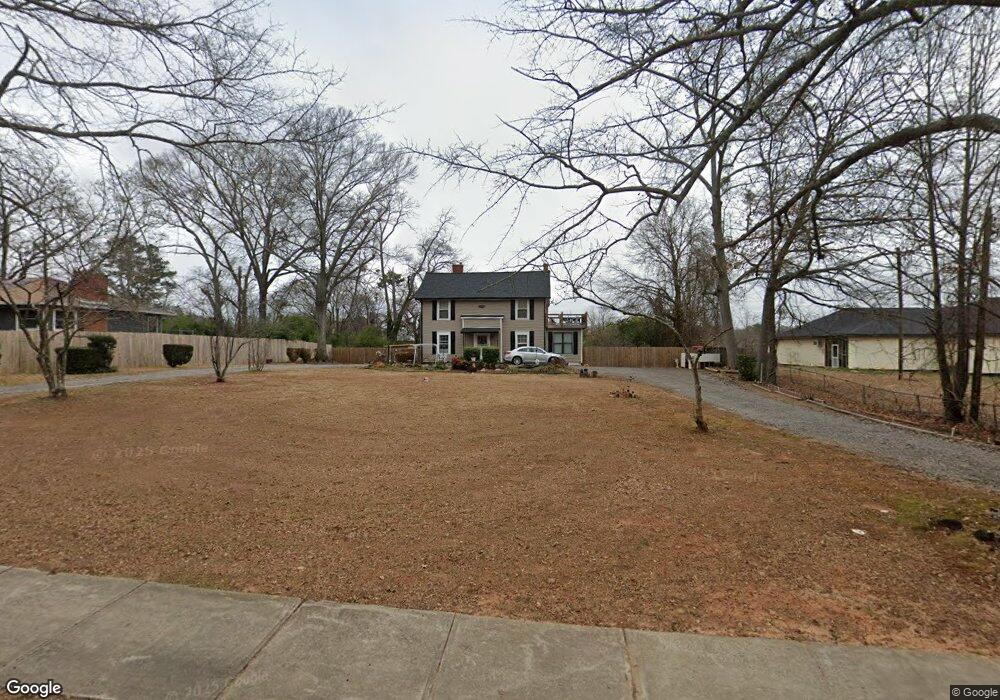
1221 W Poplar St Griffin, GA 30224
Spalding County NeighborhoodEstimated Value: $200,000 - $264,000
3
Beds
3
Baths
2,290
Sq Ft
$103/Sq Ft
Est. Value
About This Home
This home is located at 1221 W Poplar St, Griffin, GA 30224 and is currently estimated at $234,889, approximately $102 per square foot. 1221 W Poplar St is a home located in Spalding County with nearby schools including Anne Street Elementary School, Rehoboth Road Middle School, and Griffin High School.
Ownership History
Date
Name
Owned For
Owner Type
Purchase Details
Closed on
Aug 19, 1997
Sold by
Rhodes Dana S
Bought by
Brown Cleveland and Brown Celia L
Current Estimated Value
Home Financials for this Owner
Home Financials are based on the most recent Mortgage that was taken out on this home.
Original Mortgage
$60,700
Outstanding Balance
$9,010
Interest Rate
7.43%
Mortgage Type
FHA
Estimated Equity
$225,879
Purchase Details
Closed on
Jul 17, 1986
Sold by
Rhodes Bennie L and Rhodes Dana S
Bought by
Rhodes Dana S
Purchase Details
Closed on
Nov 18, 1983
Sold by
Collins James Donald and Barbara Ann
Bought by
Rhodes Bennie L and Rhodes Dana S
Purchase Details
Closed on
Dec 18, 1965
Sold by
Mccorley Charles Alvin
Bought by
Collins James Donald and Barbara Ann
Purchase Details
Closed on
Apr 14, 1965
Sold by
Caldwell W W
Bought by
Mccorley Charles Alvin
Purchase Details
Closed on
Nov 21, 1960
Bought by
Caldwell W W
Create a Home Valuation Report for This Property
The Home Valuation Report is an in-depth analysis detailing your home's value as well as a comparison with similar homes in the area
Home Values in the Area
Average Home Value in this Area
Purchase History
| Date | Buyer | Sale Price | Title Company |
|---|---|---|---|
| Brown Cleveland | $62,000 | -- | |
| Rhodes Dana S | -- | -- | |
| Rhodes Bennie L | $37,000 | -- | |
| Collins James Donald | $18,700 | -- | |
| Mccorley Charles Alvin | $18,200 | -- | |
| Caldwell W W | $15,400 | -- |
Source: Public Records
Mortgage History
| Date | Status | Borrower | Loan Amount |
|---|---|---|---|
| Open | Brown Cleveland | $60,700 |
Source: Public Records
Tax History Compared to Growth
Tax History
| Year | Tax Paid | Tax Assessment Tax Assessment Total Assessment is a certain percentage of the fair market value that is determined by local assessors to be the total taxable value of land and additions on the property. | Land | Improvement |
|---|---|---|---|---|
| 2024 | -- | $72,820 | $9,600 | $63,220 |
| 2023 | $0 | $70,388 | $9,600 | $60,788 |
| 2022 | $2,375 | $59,424 | $8,000 | $51,424 |
| 2021 | $1,677 | $37,912 | $5,600 | $32,312 |
| 2020 | $951 | $21,502 | $5,600 | $15,902 |
| 2019 | $951 | $21,502 | $5,600 | $15,902 |
| 2018 | $0 | $19,862 | $5,600 | $14,262 |
| 2017 | $879 | $19,862 | $5,600 | $14,262 |
| 2016 | $0 | $19,862 | $5,600 | $14,262 |
| 2015 | -- | $19,862 | $5,600 | $14,262 |
| 2014 | -- | $19,862 | $5,600 | $14,262 |
Source: Public Records
Map
Nearby Homes
- 305 S 18th St
- 309 Cherokee Cir
- 1264 Cherokee Ave
- 1054 W College Street Extension
- 1313 D F Fuller Dr
- 1012 W College Extension
- 141 North Expy
- 915 W Poplar St
- 203 Hillside Cir
- 1206 Hillwood Ave
- 1223 W Broad St
- 1126 Wright St
- 1228-1328 Edgewood Ave
- 1025 W Broad St
- 1106 Wright St
- 1017 W Broad St
- 930 W Broad St
- 822 W Solomon St
- 306 Louise Ln Unit A
- 124 Ohoopee Dr
- 1231 W Poplar St
- 1205 W Poplar St
- 1241 W Poplar St
- 1222 W Poplar St
- 1236 W Poplar St
- 1251 W Poplar St
- 1214 W Poplar St
- 1202 W Poplar St
- 0 Cherokee Cir Unit 8718522
- 0 Cherokee Cir Unit 8177831
- 0 Cherokee Cir Unit 8657033
- 0 Cherokee Cir Unit 8956840
- 0 Cherokee Cir Unit 3234884
- 0 Cherokee Cir Unit 7032948
- 0 Cherokee Cir
- 301 Cherokee Cir
- 1257 W Poplar St
- 302 Cherokee Cir
- 1252 W Poplar St
- 303 Cherokee Cir