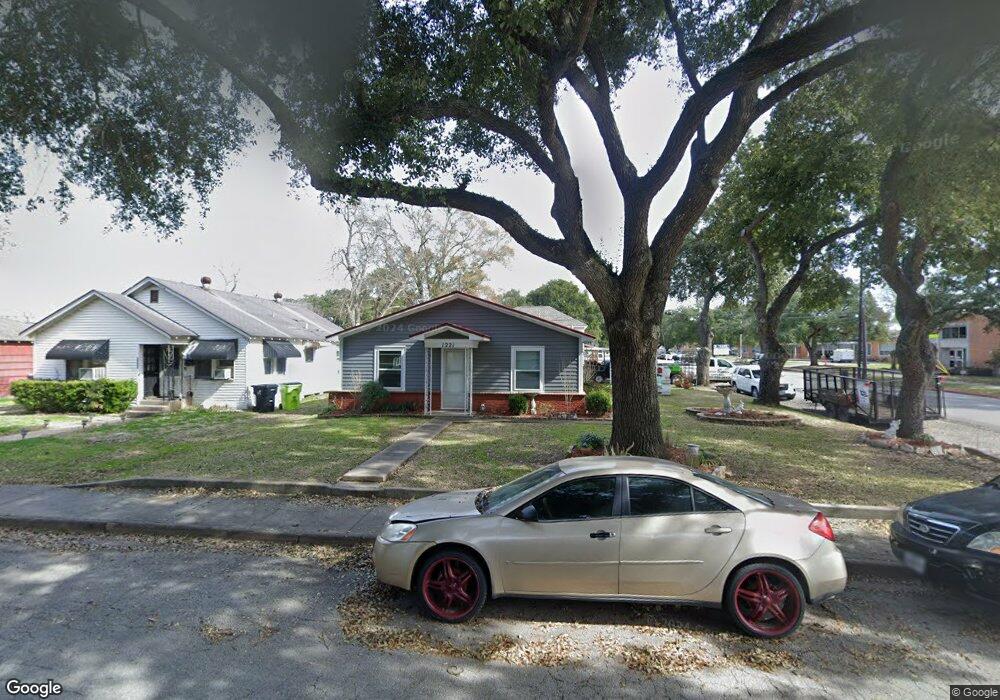
1221 Ward St Rosenberg, TX 77471
Estimated Value: $169,110 - $248,000
2
Beds
2
Baths
1,376
Sq Ft
$142/Sq Ft
Est. Value
About This Home
This home is located at 1221 Ward St, Rosenberg, TX 77471 and is currently estimated at $195,778, approximately $142 per square foot. 1221 Ward St is a home located in Fort Bend County with nearby schools including Travis Elementary School, George Junior High School, and B.F. Terry High School.
Ownership History
Date
Name
Owned For
Owner Type
Purchase Details
Closed on
Nov 24, 2020
Sold by
Rubio Rebecca Ann and Rubio Jaime
Bought by
Gonzalez Jose Manuel Dimas and Dimas Norma Henriquez
Current Estimated Value
Purchase Details
Closed on
Jul 14, 2014
Sold by
Mcneil Steven W and Mcneil Juanita A
Bought by
Gonzalez Jose Manuel Dimas and Norma Henriquez
Purchase Details
Closed on
May 14, 2012
Sold by
Elliston Eldon Lee
Bought by
Mcneil Steven W and Mcneil Juanita A
Purchase Details
Closed on
Dec 18, 2005
Sold by
Elliston Elnora
Bought by
Gonzalez Jose Manuel Dimas and Norma Henriquez
Create a Home Valuation Report for This Property
The Home Valuation Report is an in-depth analysis detailing your home's value as well as a comparison with similar homes in the area
Home Values in the Area
Average Home Value in this Area
Purchase History
| Date | Buyer | Sale Price | Title Company |
|---|---|---|---|
| Gonzalez Jose Manuel Dimas | -- | Stewart Title | |
| Gonzalez Jose Manuel Dimas | -- | -- | |
| Mcneil Steven W | -- | Startex Title Company #01 | |
| Gonzalez Jose Manuel Dimas | -- | -- | |
| Gonzalez Jose Manuel Dimas | -- | -- |
Source: Public Records
Tax History
| Year | Tax Paid | Tax Assessment Tax Assessment Total Assessment is a certain percentage of the fair market value that is determined by local assessors to be the total taxable value of land and additions on the property. | Land | Improvement |
|---|---|---|---|---|
| 2025 | $2,874 | $127,289 | $57,462 | $69,827 |
| 2024 | $2,874 | $152,150 | $57,462 | $94,688 |
| 2023 | $2,874 | $139,867 | $44,471 | $95,396 |
| 2022 | $2,675 | $130,600 | $44,470 | $86,130 |
| 2021 | $2,411 | $116,210 | $40,680 | $75,530 |
| 2020 | $2,644 | $124,560 | $40,110 | $84,450 |
| 2019 | $1,857 | $81,310 | $24,580 | $56,730 |
| 2018 | $1,817 | $78,300 | $24,580 | $53,720 |
| 2017 | $1,783 | $76,370 | $24,580 | $51,790 |
| 2016 | $1,644 | $70,450 | $24,580 | $45,870 |
| 2015 | $1,679 | $71,550 | $24,580 | $46,970 |
| 2014 | $1,694 | $71,350 | $24,580 | $46,770 |
Source: Public Records
Map
Nearby Homes
Your Personal Tour Guide
Ask me questions while you tour the home.