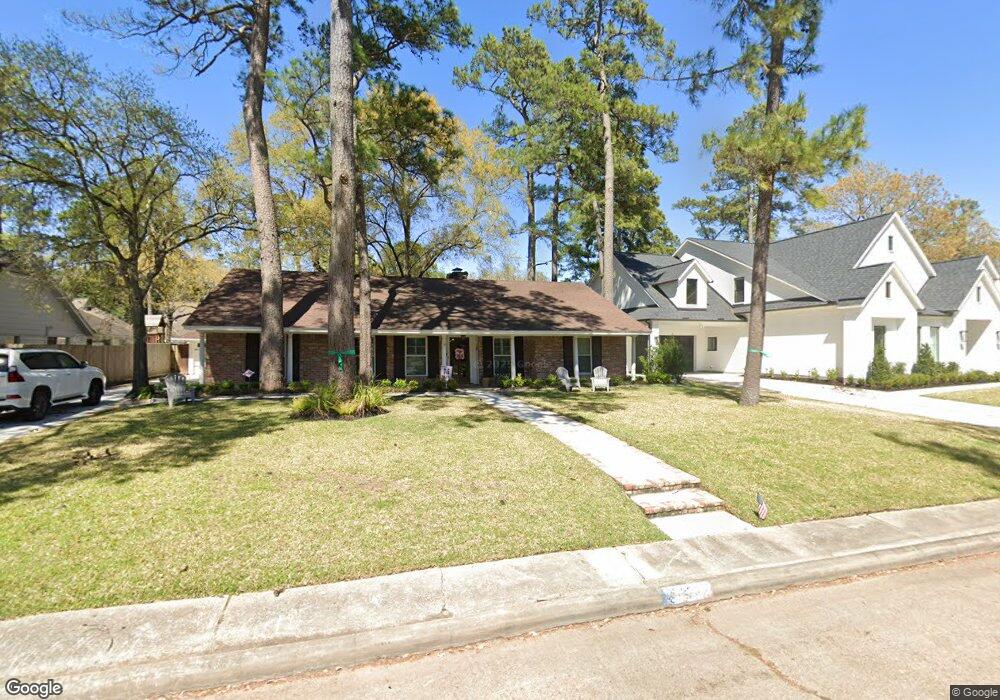
12210 Old Oaks Dr Houston, TX 77024
Memorial NeighborhoodEstimated Value: $953,000 - $1,260,000
3
Beds
2
Baths
2,115
Sq Ft
$498/Sq Ft
Est. Value
About This Home
This home is located at 12210 Old Oaks Dr, Houston, TX 77024 and is currently estimated at $1,052,759, approximately $497 per square foot. 12210 Old Oaks Dr is a home located in Harris County with nearby schools including Frostwood Elementary School, Memorial Middle, and Memorial High School.
Ownership History
Date
Name
Owned For
Owner Type
Purchase Details
Closed on
Apr 19, 2004
Sold by
Saied Richard Larsen
Bought by
Masucci Hayes W and Masucci Samantha W
Current Estimated Value
Purchase Details
Closed on
Mar 16, 2001
Sold by
Fleming Jon M and Fleming Jeanne S
Bought by
Saied Richard Larsen
Home Financials for this Owner
Home Financials are based on the most recent Mortgage that was taken out on this home.
Original Mortgage
$160,000
Interest Rate
7.1%
Purchase Details
Closed on
Sep 12, 1997
Sold by
Talbot J Scott and Talbot Fabene Welch
Bought by
Fleming Jon M and Fleming Jeanne S
Home Financials for this Owner
Home Financials are based on the most recent Mortgage that was taken out on this home.
Original Mortgage
$209,200
Interest Rate
7.34%
Create a Home Valuation Report for This Property
The Home Valuation Report is an in-depth analysis detailing your home's value as well as a comparison with similar homes in the area
Home Values in the Area
Average Home Value in this Area
Purchase History
| Date | Buyer | Sale Price | Title Company |
|---|---|---|---|
| Masucci Hayes W | -- | Lawyers Title Company | |
| Saied Richard Larsen | -- | Texas American Title Company | |
| Fleming Jon M | -- | Charter Title Company |
Source: Public Records
Mortgage History
| Date | Status | Borrower | Loan Amount |
|---|---|---|---|
| Previous Owner | Saied Richard Larsen | $160,000 | |
| Previous Owner | Fleming Jon M | $209,200 |
Source: Public Records
Tax History Compared to Growth
Tax History
| Year | Tax Paid | Tax Assessment Tax Assessment Total Assessment is a certain percentage of the fair market value that is determined by local assessors to be the total taxable value of land and additions on the property. | Land | Improvement |
|---|---|---|---|---|
| 2025 | $13,403 | $907,503 | $731,508 | $175,995 |
| 2024 | $13,403 | $821,122 | $691,967 | $129,155 |
| 2023 | $13,403 | $821,571 | $691,967 | $129,604 |
| 2022 | $17,964 | $768,392 | $642,541 | $125,851 |
| 2021 | $17,340 | $710,236 | $593,114 | $117,122 |
| 2020 | $17,414 | $694,991 | $593,114 | $101,877 |
| 2019 | $18,195 | $694,991 | $593,114 | $101,877 |
| 2018 | $7,148 | $730,308 | $593,114 | $137,194 |
| 2017 | $19,106 | $730,308 | $593,114 | $137,194 |
| 2016 | $18,800 | $730,308 | $593,114 | $137,194 |
| 2015 | $12,437 | $730,308 | $593,114 | $137,194 |
| 2014 | $12,437 | $619,599 | $444,836 | $174,763 |
Source: Public Records
Map
Nearby Homes
- 12222 Broken Bough Dr
- 601 Strey Ln
- 12326 Old Oaks Dr
- 12406 Overcup Dr
- 12003 Tall Oaks St
- 12334 Beauregard Dr
- 12231 Kimberley Ln
- 11910 Heritage Ln
- 358 Tealwood Dr
- 354 Tealwood Dr
- 12511 Overcup Dr
- 12318 Queensbury Ln
- 12315 Barryknoll Ln
- 234 Plantation Rd
- 336 Litchfield Ln
- 12327 Tunbridge Ln
- 318 Litchfield Ln
- 12602 Overcup Dr
- 345 Knipp Rd
- 113 Memorial Parkview Dr
- 12206 Old Oaks Dr
- 12214 Old Oaks Dr
- 12207 Overcup Dr
- 12211 Overcup Dr
- 12202 Old Oaks Dr
- 12218 Old Oaks Dr
- 12211 Old Oaks Dr
- 12215 Overcup Dr
- 12215 Old Oaks Dr
- 12207 Old Oaks Dr
- 12219 Old Oaks Dr
- 12219 Overcup Dr
- 12222 Old Oaks Dr
- 12203 Old Oaks Dr
- 12206 Overcup Dr
- 12214 Mossycup Dr
- 12210 Mossycup Dr
- 12134 Old Oaks Dr
- 12223 Old Oaks Dr
- 12135 Overcup Dr