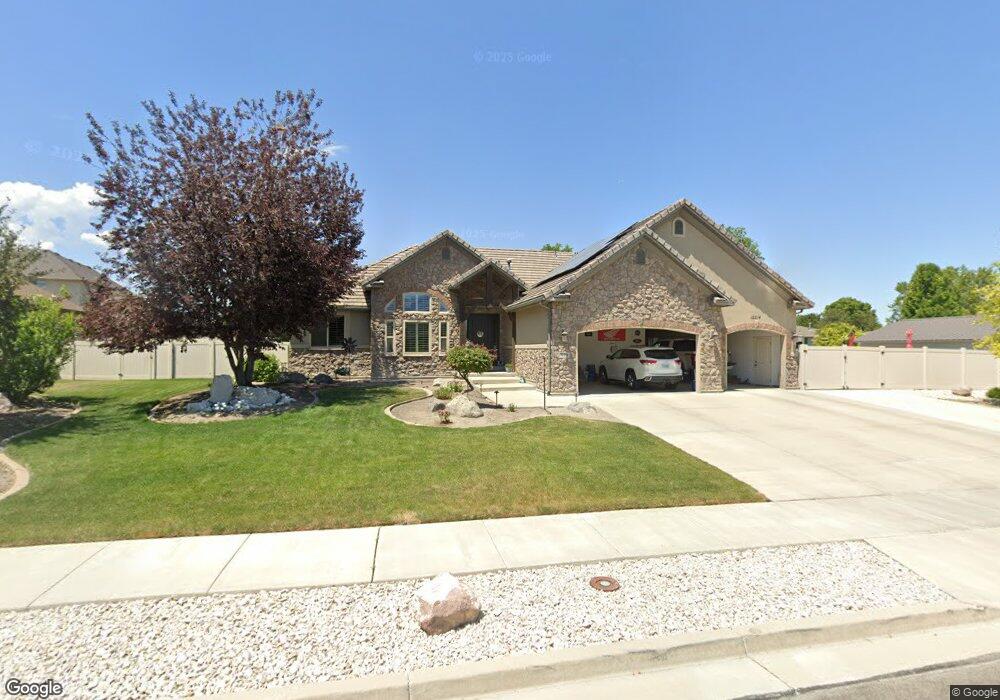
12214 S Haven Hills Rd Riverton, UT 84065
Estimated Value: $949,000 - $1,015,000
5
Beds
4
Baths
3,917
Sq Ft
$250/Sq Ft
Est. Value
About This Home
This home is located at 12214 S Haven Hills Rd, Riverton, UT 84065 and is currently estimated at $979,616, approximately $250 per square foot. 12214 S Haven Hills Rd is a home located in Salt Lake County with nearby schools including Southland Elementary School, Oquirrh Hills Middle School, and Riverton High School.
Ownership History
Date
Name
Owned For
Owner Type
Purchase Details
Closed on
Jul 8, 2019
Sold by
Linford Val J and Linford Janice
Bought by
Linford Vat Jay and Linford Janice
Current Estimated Value
Purchase Details
Closed on
Jun 30, 2014
Sold by
Rice Jeffery R
Bought by
Linford Val J and Linford Janice
Purchase Details
Closed on
Jan 14, 2008
Sold by
Rice Jeffery R
Bought by
Rice Jeffery R and Rice Annette S
Home Financials for this Owner
Home Financials are based on the most recent Mortgage that was taken out on this home.
Original Mortgage
$178,500
Interest Rate
6.05%
Mortgage Type
Purchase Money Mortgage
Purchase Details
Closed on
Nov 29, 2006
Sold by
Ron Thorne Construction Inc
Bought by
Thorne Homes Llc
Home Financials for this Owner
Home Financials are based on the most recent Mortgage that was taken out on this home.
Original Mortgage
$397,500
Interest Rate
6.37%
Mortgage Type
Construction
Create a Home Valuation Report for This Property
The Home Valuation Report is an in-depth analysis detailing your home's value as well as a comparison with similar homes in the area
Home Values in the Area
Average Home Value in this Area
Purchase History
| Date | Buyer | Sale Price | Title Company |
|---|---|---|---|
| Linford Vat Jay | -- | None Available | |
| Linford Val J | -- | First American Title | |
| Rice Jeffery R | -- | Accommodation | |
| Rice Jeffery R | -- | Bonneville Superior Title | |
| Thorne Homes Llc | -- | Merrill Title |
Source: Public Records
Mortgage History
| Date | Status | Borrower | Loan Amount |
|---|---|---|---|
| Previous Owner | Rice Jeffery R | $178,500 | |
| Previous Owner | Thorne Homes Llc | $397,500 |
Source: Public Records
Tax History Compared to Growth
Tax History
| Year | Tax Paid | Tax Assessment Tax Assessment Total Assessment is a certain percentage of the fair market value that is determined by local assessors to be the total taxable value of land and additions on the property. | Land | Improvement |
|---|---|---|---|---|
| 2025 | $1,144 | $986,000 | $252,100 | $733,900 |
| 2024 | $1,144 | $938,300 | $241,400 | $696,900 |
| 2023 | $1,060 | $898,200 | $236,600 | $661,600 |
| 2022 | $3,042 | $915,100 | $232,000 | $683,100 |
| 2021 | $1,670 | $686,300 | $185,600 | $500,700 |
| 2020 | $4,699 | $624,400 | $185,600 | $438,800 |
| 2019 | $223 | $612,300 | $149,600 | $462,700 |
| 2018 | $98 | $575,100 | $146,200 | $428,900 |
| 2017 | $463 | $548,400 | $146,200 | $402,200 |
| 2016 | $944 | $530,100 | $146,200 | $383,900 |
| 2015 | $564 | $454,700 | $144,800 | $309,900 |
| 2014 | $3,755 | $429,300 | $137,800 | $291,500 |
Source: Public Records
Map
Nearby Homes
- 2853 W 12075 S
- 12501 Falls Creek Rd
- 12658 Old Fort Cir
- 3168 Chalk Creek Way
- 2356 W Montcalm Dr
- 11716 S 2610 W
- 12580 S Janice Dr
- 2511 W 11730 S
- 11788 S Myers Park Ln Unit 101
- 2295 W Myers Ln
- 2626 W Midas Side Way
- 2602 W 11625 S
- 12191 S 3600 W
- 2732 W Lizzi Cove
- 11707 S Myers Park Ln Unit 111
- 3376 W Water Crescent Place
- 3371 W Waterbridge Cove Unit 417
- 11513 S Jackson Downs Way
- 3644 W Harvest Gold Way
- 11881 S Harvest Gold Way
- 12214 Haven Hills Rd
- 12228 Haven Hills Rd
- 12228 S Haven Hills Rd Unit 121 HF
- 12189 S 2845 W
- 2858 W Camden Brook Way Unit 125
- 2858 W Camden Brook Way
- 2858 Camdenbrook Way
- 12231 Madison Hills Ln
- 2809 W 12210 S
- 12178 S 2795 W
- 12229 S Haven Hills Rd
- 12229 Haven Hills Rd
- 12175 S 2845 W
- 2876 Camdenbrook Way
- 2852 W Serene Park Dr
- 2852 Serene Park Dr
- 12168 S 2795 W
- 12251 Haven Hills Rd
- 2787 W 12210 S
- 2836 Serene Park Dr