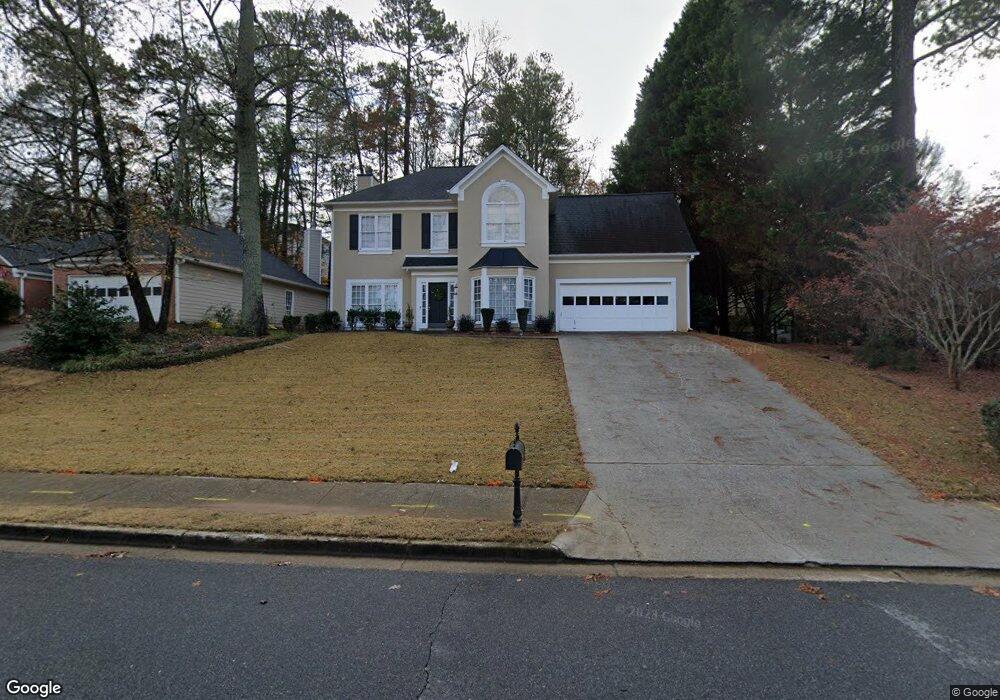
12215 Leeward Walk Cir Alpharetta, GA 30005
Windward NeighborhoodEstimated Value: $558,000 - $582,000
4
Beds
3
Baths
2,276
Sq Ft
$251/Sq Ft
Est. Value
About This Home
This home is located at 12215 Leeward Walk Cir, Alpharetta, GA 30005 and is currently estimated at $572,013, approximately $251 per square foot. 12215 Leeward Walk Cir is a home located in Fulton County with nearby schools including Lake Windward Elementary School, Taylor Road Middle School, and Chattahoochee High School.
Ownership History
Date
Name
Owned For
Owner Type
Purchase Details
Closed on
Jul 1, 2022
Sold by
Lange Terry W
Bought by
Hancock Timothy R and Hancock Cierra N
Current Estimated Value
Home Financials for this Owner
Home Financials are based on the most recent Mortgage that was taken out on this home.
Original Mortgage
$427,500
Outstanding Balance
$406,718
Interest Rate
5.09%
Mortgage Type
New Conventional
Estimated Equity
$165,295
Purchase Details
Closed on
Sep 1, 2011
Sold by
Federal National Mortgage Association
Bought by
Lange Terry W
Home Financials for this Owner
Home Financials are based on the most recent Mortgage that was taken out on this home.
Original Mortgage
$159,300
Interest Rate
4.4%
Mortgage Type
New Conventional
Purchase Details
Closed on
Nov 2, 2010
Sold by
Wells Fargo Bk Na
Bought by
Federal Natl Mtg Assn Fnma
Purchase Details
Closed on
Jun 24, 1994
Sold by
Spies John B Denise P
Bought by
Avery Robert M
Create a Home Valuation Report for This Property
The Home Valuation Report is an in-depth analysis detailing your home's value as well as a comparison with similar homes in the area
Home Values in the Area
Average Home Value in this Area
Purchase History
| Date | Buyer | Sale Price | Title Company |
|---|---|---|---|
| Hancock Timothy R | $450,000 | -- | |
| Lange Terry W | -- | -- | |
| Federal Natl Mtg Assn Fnma | -- | -- | |
| Wells Fargo Bk Na | $217,307 | -- | |
| Avery Robert M | $141,500 | -- |
Source: Public Records
Mortgage History
| Date | Status | Borrower | Loan Amount |
|---|---|---|---|
| Open | Hancock Timothy R | $427,500 | |
| Previous Owner | Lange Terry W | $159,300 |
Source: Public Records
Tax History Compared to Growth
Tax History
| Year | Tax Paid | Tax Assessment Tax Assessment Total Assessment is a certain percentage of the fair market value that is determined by local assessors to be the total taxable value of land and additions on the property. | Land | Improvement |
|---|---|---|---|---|
| 2025 | $810 | $180,000 | $52,760 | $127,240 |
| 2023 | $5,081 | $180,000 | $52,760 | $127,240 |
| 2022 | $4,146 | $157,600 | $42,880 | $114,720 |
| 2021 | $3,993 | $121,440 | $34,000 | $87,440 |
| 2020 | $4,284 | $127,720 | $31,080 | $96,640 |
| 2019 | $642 | $111,640 | $19,520 | $92,120 |
| 2018 | $3,077 | $109,000 | $19,040 | $89,960 |
| 2017 | $2,319 | $79,480 | $15,800 | $63,680 |
| 2016 | $2,319 | $79,480 | $15,800 | $63,680 |
| 2015 | $2,786 | $79,480 | $15,800 | $63,680 |
| 2014 | $2,029 | $66,200 | $13,160 | $53,040 |
Source: Public Records
Map
Nearby Homes
- 11835 Leeward Walk Cir
- 12205 Stevens Creek Dr
- 1895 Oak Tree Hollow
- 5200 Cresslyn Ridge
- 5455 Woodrun Ln
- 440 Newport Heights
- 12470 Concord Hall Dr
- 3770 Newport Bay Dr
- 2250 Blackheath Trace
- 5575 Ashwind Trace
- 5440 Vicarage Walk
- 12595 Huntington Trace
- 5650 Preserve Cir
- 410 Fox Chase Cir
- 5735 Sunset Maple Dr
- 11615 Windbrooke Way
- 12225 Leeward Walk Cir
- 304 Leeward Walk Ln
- 314 Leeward Walk Ln
- 12235 Leeward Walk Cir
- 535 Creek Landing Ln Unit 2
- 525 Creek Landing Ln Unit 2
- 324 Leeward Walk Ln
- 545 Creek Landing Ln Unit 2
- 225 Leeward Ln
- 12230 Leeward Walk Cir Unit 2
- 515 Creek Landing Ln Unit 2
- 303 Leeward Walk Ln
- 555 Creek Landing Ln
- 505 Creek Landing Ln
- 12250 Leeward Walk Cir
- 12220 Leeward Walk Cir
- 334 Leeward Walk Ln Unit 2
- 0 Leeward Walk Unit 9009205
- 0 Leeward Walk Unit 9034730
- 565 Creek Landing Ln Unit 2