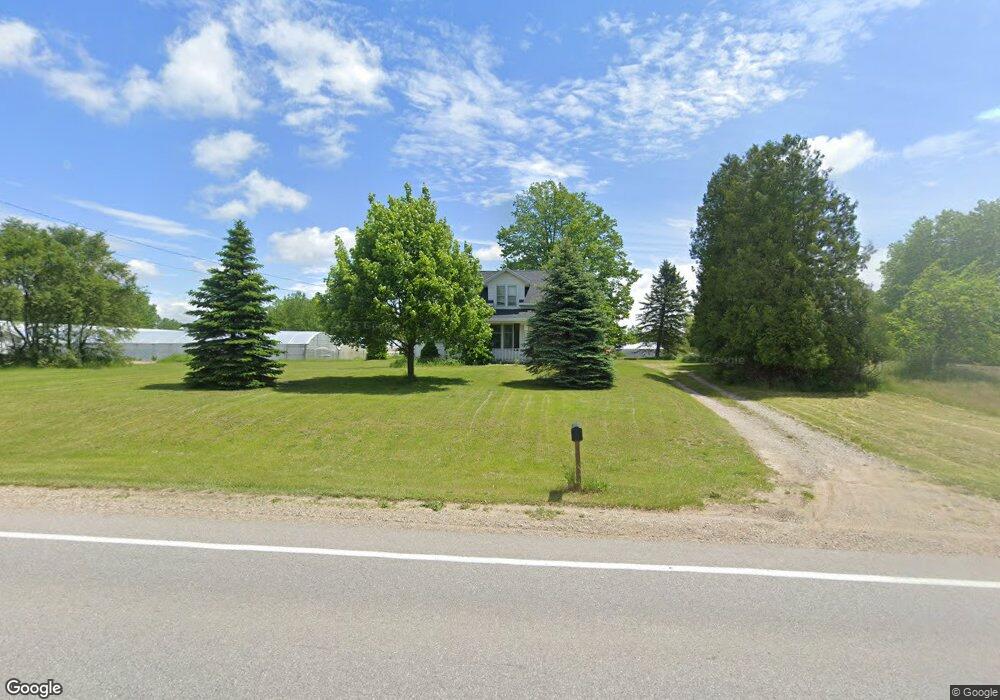
12218 68th Ave Allendale, MI 49401
Estimated Value: $341,393 - $373,000
3
Beds
2
Baths
2,247
Sq Ft
$158/Sq Ft
Est. Value
About This Home
This home is located at 12218 68th Ave, Allendale, MI 49401 and is currently estimated at $354,098, approximately $157 per square foot. 12218 68th Ave is a home located in Ottawa County with nearby schools including Evergreen Elementary School, Allendale Middle School, and Allendale High School.
Ownership History
Date
Name
Owned For
Owner Type
Purchase Details
Closed on
Jun 3, 2010
Sold by
Post Brett and Post Kathleen
Bought by
Ogg James D and Higgins Cynthia R
Current Estimated Value
Home Financials for this Owner
Home Financials are based on the most recent Mortgage that was taken out on this home.
Original Mortgage
$130,612
Outstanding Balance
$88,221
Interest Rate
5.13%
Mortgage Type
New Conventional
Estimated Equity
$265,877
Purchase Details
Closed on
Oct 1, 2004
Sold by
Vantimmeren Herbert A and Vantimmeren Karen
Bought by
Vantimmeren Calvin Lee
Purchase Details
Closed on
Jul 14, 2004
Sold by
Vantimmerman Herbert A and Vantimmerman Karen
Bought by
Post Brett and Post Kathleen
Home Financials for this Owner
Home Financials are based on the most recent Mortgage that was taken out on this home.
Original Mortgage
$108,000
Interest Rate
6.34%
Mortgage Type
Balloon
Purchase Details
Closed on
Aug 8, 1996
Sold by
Fcb Agribank
Bought by
Vantimmeren Herbert A and Vantimmeren Karen
Create a Home Valuation Report for This Property
The Home Valuation Report is an in-depth analysis detailing your home's value as well as a comparison with similar homes in the area
Home Values in the Area
Average Home Value in this Area
Purchase History
| Date | Buyer | Sale Price | Title Company |
|---|---|---|---|
| Ogg James D | $128,000 | Chicago Title | |
| Vantimmeren Calvin Lee | $45,000 | -- | |
| Post Brett | $135,000 | Chicago Title Of Mi | |
| Vantimmeren Herbert A | $65,000 | -- |
Source: Public Records
Mortgage History
| Date | Status | Borrower | Loan Amount |
|---|---|---|---|
| Open | Ogg James D | $130,612 | |
| Previous Owner | Post Brett | $108,000 |
Source: Public Records
Tax History
| Year | Tax Paid | Tax Assessment Tax Assessment Total Assessment is a certain percentage of the fair market value that is determined by local assessors to be the total taxable value of land and additions on the property. | Land | Improvement |
|---|---|---|---|---|
| 2025 | $2,349 | $149,800 | $0 | $0 |
| 2024 | $23 | $137,900 | $0 | $0 |
| 2023 | $2,157 | $123,400 | $0 | $0 |
| 2022 | $2,365 | $104,800 | $0 | $0 |
| 2021 | $2,296 | $98,200 | $0 | $0 |
| 2020 | $2,270 | $91,700 | $0 | $0 |
| 2019 | $2,227 | $89,000 | $0 | $0 |
| 2018 | $2,091 | $82,500 | $0 | $0 |
| 2017 | $2,039 | $80,000 | $0 | $0 |
| 2016 | $1,958 | $73,000 | $0 | $0 |
| 2015 | -- | $70,400 | $0 | $0 |
| 2014 | -- | $64,400 | $0 | $0 |
Source: Public Records
Map
Nearby Homes
- 6978 Highland Dr W
- 6230 Sumter St
- 6318 Roman Rd
- 6185 Slumber Way
- 6283 Roman Rd
- 6135 Kingsbury Ct
- 7020 Osborn St
- 12713 Ridgedale Dr
- 5966 Farmview Dr
- 5195 Lake Michigan Dr
- 12734 Lockwood Dr
- 12643 Ridgedale Dr
- 12652 Ridgedale Dr
- 5930 Grand Vista Dr
- 5925 Grand Vista Dr
- 10881 Constant Dr
- 11440 Shoreline Dr Unit 110
- 11386 Shoreline Dr
- 11440 Shoreline Dr
- 11386 Shoreline Dr Unit 114
- 12238 68th Ave
- 12227 68th Ave
- 12270 68th Ave
- 12234 Knoper Ct
- 12280 68th Ave
- 12297 68th Ave
- 12245 Knoper Ct
- 12312 68th Ave
- 12307 68th Ave
- 6885 Highland Dr E Unit 32
- 6888 Highland Dr E
- 12328 68th Ave
- 12325 68th Ave
- 12122 68th Ave
- 6894 Highland Ct
- 12240 Knoper Ct
- 6891 Highland Ct Unit 42
- 6900 Highland Ct Unit 40
- 6901 Highland Dr E
- 12345 68th Ave
Your Personal Tour Guide
Ask me questions while you tour the home.