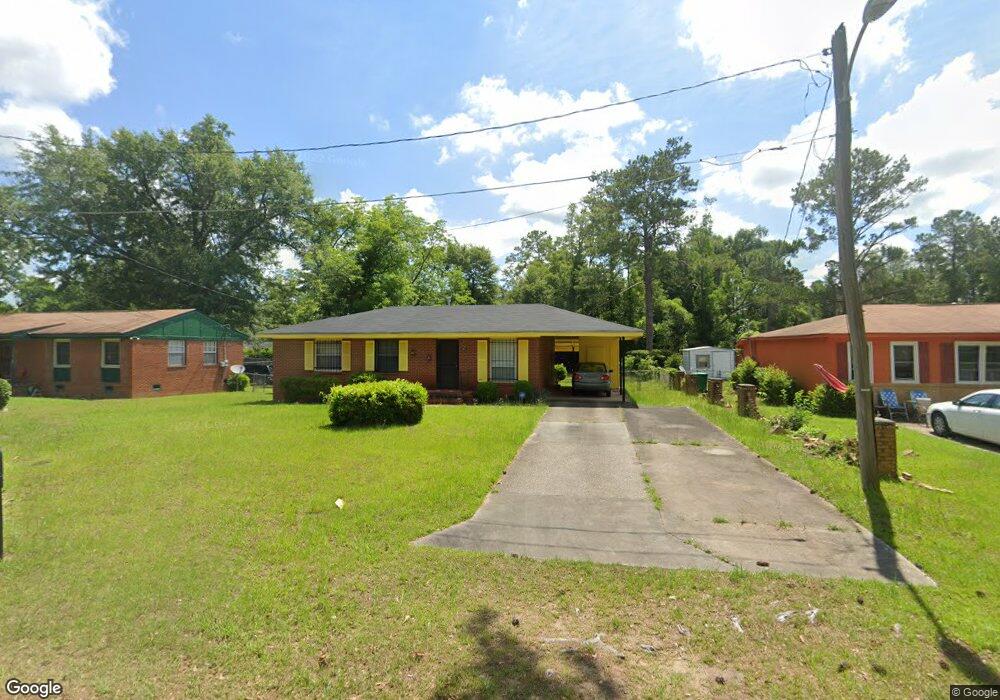
1222 Estelle St Albany, GA 31705
Estimated Value: $69,501 - $88,000
3
Beds
2
Baths
975
Sq Ft
$79/Sq Ft
Est. Value
About This Home
This home is located at 1222 Estelle St, Albany, GA 31705 and is currently estimated at $76,625, approximately $78 per square foot. 1222 Estelle St is a home located in Dougherty County with nearby schools including Robert H. Harvey Elementary School, Albany Middle School, and Dougherty Comprehensive High School.
Ownership History
Date
Name
Owned For
Owner Type
Purchase Details
Closed on
May 15, 1998
Sold by
Beneficial Mortgage Co Of Ga
Bought by
Green Lelie A M
Current Estimated Value
Purchase Details
Closed on
Feb 27, 1998
Sold by
Greyfield Resources Inc
Bought by
Beneficial Mortgage Co Of Ga
Purchase Details
Closed on
Dec 16, 1997
Sold by
Alford Patricia A By Atty/Fact
Bought by
Beneficial Mortgage Co Of Ga
Purchase Details
Closed on
Aug 5, 1997
Sold by
Alford Patricia Ann By City Marshall & S
Bought by
Greyfield Resources
Purchase Details
Closed on
Jul 31, 1995
Sold by
Aldridge Jerry D and Aldridge Patricia
Bought by
White James M (Release Of Security Deed
Purchase Details
Closed on
Jan 26, 1993
Sold by
So Ga Ewuity Corp
Bought by
Alford Patricia Ann
Purchase Details
Closed on
Nov 5, 1991
Sold by
White James M
Bought by
So Ga Equity Corp
Purchase Details
Closed on
Feb 11, 1986
Sold by
Aldridge Jerry D
Bought by
White James M
Create a Home Valuation Report for This Property
The Home Valuation Report is an in-depth analysis detailing your home's value as well as a comparison with similar homes in the area
Home Values in the Area
Average Home Value in this Area
Purchase History
| Date | Buyer | Sale Price | Title Company |
|---|---|---|---|
| Green Lelie A M | $44,500 | -- | |
| Beneficial Mortgage Co Of Ga | -- | -- | |
| Beneficial Mortgage Co Of Ga | -- | -- | |
| Greyfield Resources | -- | -- | |
| White James M (Release Of Security Deed | -- | -- | |
| Alford Patricia Ann | $22,700 | -- | |
| So Ga Equity Corp | $17,000 | -- | |
| White James M | -- | -- |
Source: Public Records
Tax History Compared to Growth
Tax History
| Year | Tax Paid | Tax Assessment Tax Assessment Total Assessment is a certain percentage of the fair market value that is determined by local assessors to be the total taxable value of land and additions on the property. | Land | Improvement |
|---|---|---|---|---|
| 2024 | $788 | $18,520 | $2,480 | $16,040 |
| 2023 | $0 | $18,520 | $2,480 | $16,040 |
| 2022 | $773 | $18,520 | $2,480 | $16,040 |
| 2021 | $716 | $18,520 | $2,480 | $16,040 |
| 2020 | $718 | $18,520 | $2,480 | $16,040 |
| 2019 | $721 | $18,520 | $2,480 | $16,040 |
| 2018 | $724 | $18,520 | $2,480 | $16,040 |
| 2017 | $674 | $18,520 | $2,480 | $16,040 |
| 2016 | $675 | $18,520 | $2,480 | $16,040 |
| 2015 | $676 | $18,520 | $2,480 | $16,040 |
| 2014 | $668 | $18,520 | $2,480 | $16,040 |
Source: Public Records
Map
Nearby Homes
- 1500 Evelyn Ave
- 1618 Beverly Ave
- 1616 Cromartie Beach Dr
- 1604, 1606, 1607 Cromartie Beach Dr
- 1901 S Flintlock Dr
- 1978 S Riverview Cir
- 1980 S Riverview Cir
- 1982 S Riverview Cir
- 1412 Westcliff Ct
- 1323 E Society Ave
- 1405 Westcliff Ct
- 1107 E 4th Ave
- 2034 N Riverview Cir
- 1418 E Roosevelt Ave
- 1410 E Roosevelt Ave
- 1007 Swift St
- 1318 E Roosevelt Ave
- 119 N West Rd
- 1532 E Broad Ave
- 1001 Hobson St