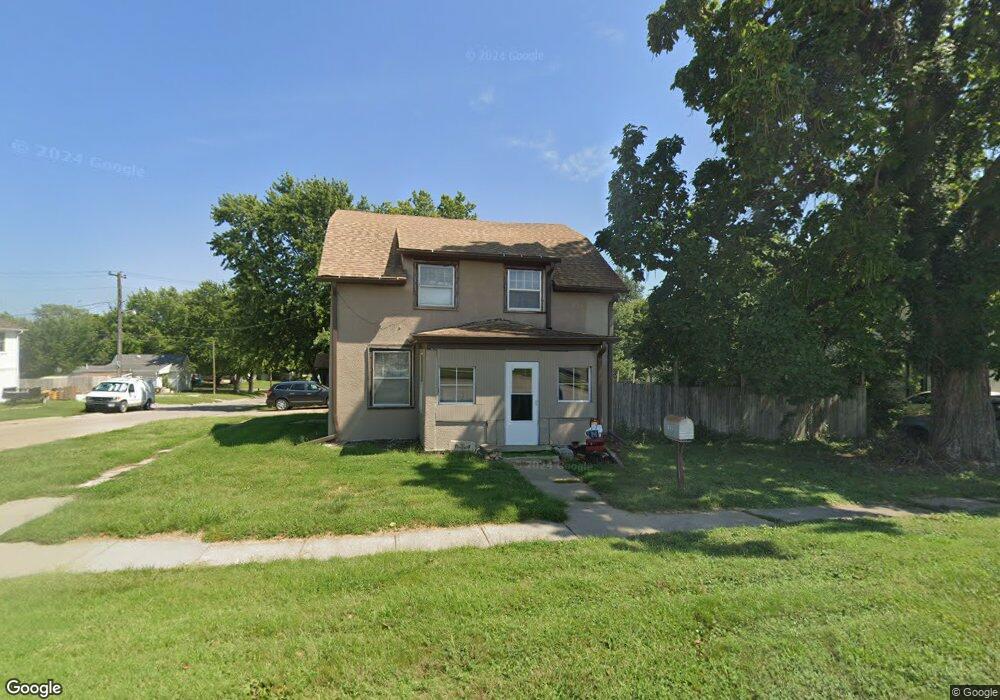
1222 Harlan St Falls City, NE 68355
Estimated Value: $66,000 - $110,000
3
Beds
3
Baths
1,287
Sq Ft
$67/Sq Ft
Est. Value
About This Home
This home is located at 1222 Harlan St, Falls City, NE 68355 and is currently estimated at $86,473, approximately $67 per square foot. 1222 Harlan St is a home located in Richardson County with nearby schools including Falls City North Elementary School, Falls City South Elementary School, and Falls City Middle School.
Ownership History
Date
Name
Owned For
Owner Type
Purchase Details
Closed on
Dec 11, 2008
Sold by
Janko Dorothy E
Bought by
Kaster Elizabeth Kaye and Kaster Michael
Current Estimated Value
Purchase Details
Closed on
Sep 24, 2008
Sold by
Janko Life Est Dorothy E
Bought by
Janko Dorothy E
Purchase Details
Closed on
Apr 6, 2005
Sold by
Janko Dorothy E
Bought by
Janko Life Est Dorothy E
Purchase Details
Closed on
Mar 9, 2005
Sold by
Inglis Ron L
Bought by
Janko Dorothy E
Purchase Details
Closed on
May 31, 2000
Sold by
Tyler David J and Tyler Margaret F
Bought by
Inglis Ron L
Create a Home Valuation Report for This Property
The Home Valuation Report is an in-depth analysis detailing your home's value as well as a comparison with similar homes in the area
Home Values in the Area
Average Home Value in this Area
Purchase History
| Date | Buyer | Sale Price | Title Company |
|---|---|---|---|
| Kaster Elizabeth Kaye | $10,000 | -- | |
| Kaster Elizabeth Kaye | $10,000 | -- | |
| Janko Dorothy E | -- | -- | |
| Janko Life Est Dorothy E | -- | -- | |
| Janko Dorothy E | $26,500 | -- | |
| Inglis Ron L | $25,000 | -- |
Source: Public Records
Tax History Compared to Growth
Tax History
| Year | Tax Paid | Tax Assessment Tax Assessment Total Assessment is a certain percentage of the fair market value that is determined by local assessors to be the total taxable value of land and additions on the property. | Land | Improvement |
|---|---|---|---|---|
| 2025 | $551 | $48,653 | $3,741 | $44,912 |
| 2024 | $551 | $42,761 | $3,741 | $39,020 |
| 2023 | $404 | $24,624 | $3,741 | $20,883 |
| 2022 | $433 | $22,570 | $2,420 | $20,150 |
| 2021 | $619 | $33,019 | $2,420 | $30,599 |
| 2020 | $598 | $31,562 | $2,420 | $29,142 |
| 2019 | $591 | $30,713 | $2,420 | $28,293 |
| 2018 | $581 | $29,889 | $2,420 | $27,469 |
| 2017 | $582 | $29,889 | $2,420 | $27,469 |
| 2016 | $564 | $29,099 | $2,430 | $26,669 |
| 2015 | $565 | $29,099 | $2,430 | $26,669 |
| 2014 | $565 | $29,099 | $2,430 | $26,669 |
Source: Public Records
Map
Nearby Homes