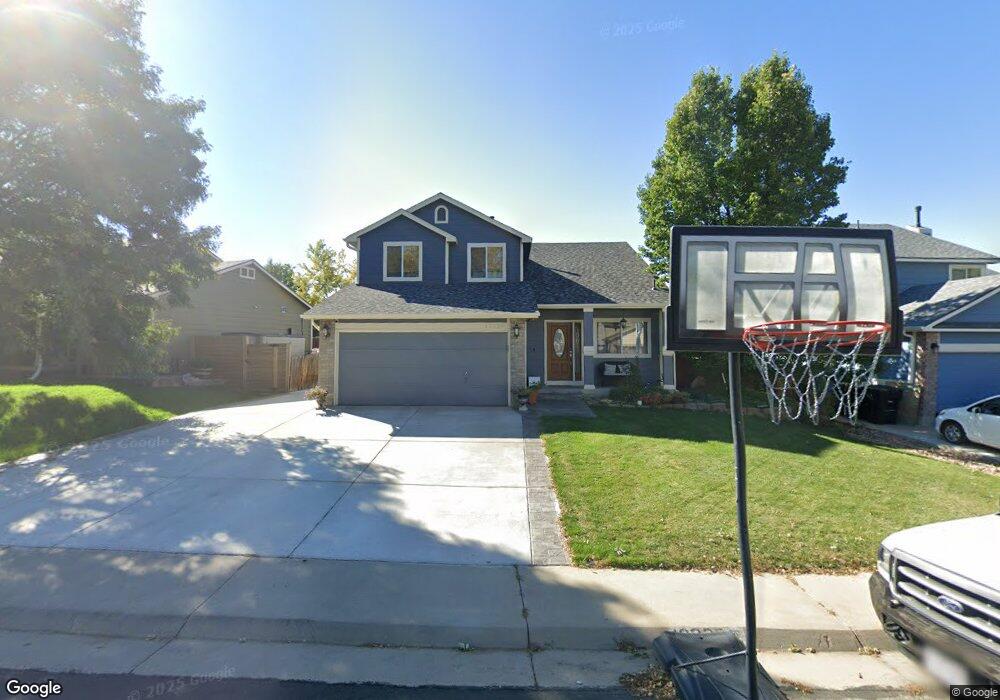
12225 Grape St Thornton, CO 80241
Concord NeighborhoodEstimated Value: $518,724 - $542,000
3
Beds
3
Baths
2,054
Sq Ft
$257/Sq Ft
Est. Value
About This Home
This home is located at 12225 Grape St, Thornton, CO 80241 and is currently estimated at $527,931, approximately $257 per square foot. 12225 Grape St is a home located in Adams County with nearby schools including Skyview Elementary School, Shadow Ridge Middle School, and Horizon High School.
Ownership History
Date
Name
Owned For
Owner Type
Purchase Details
Closed on
Dec 7, 2015
Sold by
Fisher Rodney A and Fisher Susan M
Bought by
Cabrera Gerardo C and Cabrera Rosio
Current Estimated Value
Home Financials for this Owner
Home Financials are based on the most recent Mortgage that was taken out on this home.
Original Mortgage
$286,225
Outstanding Balance
$226,430
Interest Rate
3.88%
Mortgage Type
New Conventional
Estimated Equity
$301,501
Purchase Details
Closed on
Sep 28, 1995
Sold by
Melody Homes Inc
Bought by
Fisher Rodney A and Fisher Susan M
Home Financials for this Owner
Home Financials are based on the most recent Mortgage that was taken out on this home.
Original Mortgage
$129,300
Interest Rate
7.84%
Create a Home Valuation Report for This Property
The Home Valuation Report is an in-depth analysis detailing your home's value as well as a comparison with similar homes in the area
Home Values in the Area
Average Home Value in this Area
Purchase History
| Date | Buyer | Sale Price | Title Company |
|---|---|---|---|
| Cabrera Gerardo C | $301,500 | First American Title | |
| Fisher Rodney A | $136,121 | Land Title |
Source: Public Records
Mortgage History
| Date | Status | Borrower | Loan Amount |
|---|---|---|---|
| Open | Cabrera Gerardo C | $286,225 | |
| Previous Owner | Fisher Rodney A | $129,300 |
Source: Public Records
Tax History Compared to Growth
Tax History
| Year | Tax Paid | Tax Assessment Tax Assessment Total Assessment is a certain percentage of the fair market value that is determined by local assessors to be the total taxable value of land and additions on the property. | Land | Improvement |
|---|---|---|---|---|
| 2024 | $3,634 | $33,190 | $6,250 | $26,940 |
| 2023 | $3,597 | $38,830 | $6,090 | $32,740 |
| 2022 | $2,861 | $25,970 | $6,120 | $19,850 |
| 2021 | $2,955 | $25,970 | $6,120 | $19,850 |
| 2020 | $2,882 | $25,830 | $6,290 | $19,540 |
| 2019 | $2,887 | $25,830 | $6,290 | $19,540 |
| 2018 | $2,698 | $23,450 | $6,700 | $16,750 |
| 2017 | $2,453 | $23,450 | $6,700 | $16,750 |
| 2016 | $1,759 | $16,370 | $3,500 | $12,870 |
| 2015 | $1,757 | $16,370 | $3,500 | $12,870 |
| 2014 | -- | $14,750 | $2,870 | $11,880 |
Source: Public Records
Map
Nearby Homes
- 5757 E 122nd Dr
- 12187 Fairfax St
- 12099 Forest St
- 12065 Ivanhoe Ct
- 5805 E 124th Way
- 5913 E 121st Place
- 12450 Kearney Cir
- 12172 Dahlia Dr
- 5953 E 121st Place
- 5160 E 120th Place
- 12506 Forest Dr
- 12388 Jasmine St
- 12530 Forest Dr
- 12052 Eudora Ct
- 5020 E 120th Place
- 4970 E 120th Place
- 12579 Forest Dr
- 11918 Glencoe Dr
- 12609 Jersey Cir W
- 12292 Krameria St
- 12235 Grape St
- 12215 Grape St
- 12245 Grape St
- 12224 Glencoe St
- 12234 Glencoe St
- 12205 Grape St
- 12214 Glencoe St
- 12244 Glencoe St
- 12226 Grape St
- 12236 Grape St
- 12255 Grape St
- 12216 Grape St
- 12246 Grape St
- 12204 Glencoe St
- 12254 Glencoe St
- 12206 Grape St
- 12265 Grape St
- 12256 Grape St
- 12185 Grape St
- 12194 Glencoe St