Estimated Value: $292,000 - $299,000
3
Beds
2
Baths
1,883
Sq Ft
$157/Sq Ft
Est. Value
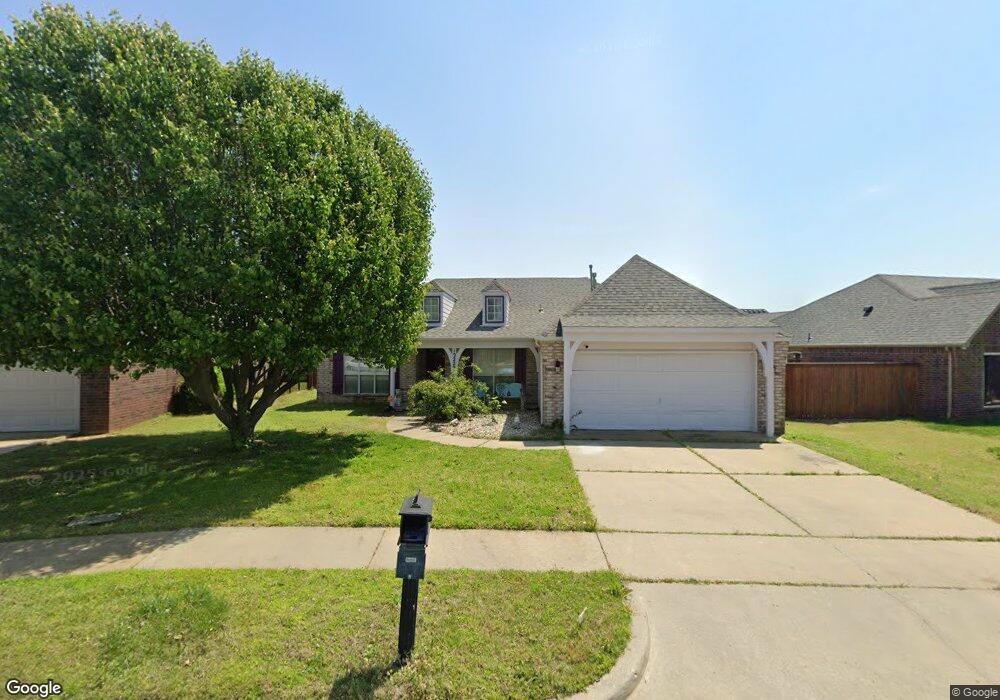
About This Home
This home is located at 12229 S Cedar Ave, Jenks, OK 74037 and is currently estimated at $295,733, approximately $157 per square foot. 12229 S Cedar Ave is a home located in Tulsa County with nearby schools including Jenks West Elementary School, Jenks West Intermediate Elementary School, and Jenks Middle School.
Ownership History
Date
Name
Owned For
Owner Type
Purchase Details
Closed on
Oct 5, 2011
Sold by
Andrews Vanna and Camp Brian D
Bought by
Andrews Vanna A and The Vanna A Andrews 2011 Irrevocable Tru
Current Estimated Value
Purchase Details
Closed on
May 19, 2010
Sold by
Secretary Of Housing & Urban Development
Bought by
Andrews Vanna
Purchase Details
Closed on
Nov 17, 2009
Sold by
Buenahora Felicia
Bought by
Secretary Of Housing & Urban Development
Purchase Details
Closed on
Dec 15, 2005
Sold by
Lyda Joseph W and Lyda Deborah L
Bought by
Buenahora Felicia
Home Financials for this Owner
Home Financials are based on the most recent Mortgage that was taken out on this home.
Original Mortgage
$157,429
Interest Rate
6.2%
Mortgage Type
FHA
Purchase Details
Closed on
Feb 22, 2002
Sold by
Simmons Homes Residential Group Llc
Bought by
Lyda Joseph W and Lyda Deborah L
Create a Home Valuation Report for This Property
The Home Valuation Report is an in-depth analysis detailing your home's value as well as a comparison with similar homes in the area
Home Values in the Area
Average Home Value in this Area
Purchase History
| Date | Buyer | Sale Price | Title Company |
|---|---|---|---|
| Andrews Vanna A | -- | None Available | |
| Andrews Vanna | -- | None Available | |
| Secretary Of Housing & Urban Development | -- | None Available | |
| Buenahora Felicia | $160,000 | None Available | |
| Lyda Joseph W | $144,500 | Delta Title & Escrow Company |
Source: Public Records
Mortgage History
| Date | Status | Borrower | Loan Amount |
|---|---|---|---|
| Previous Owner | Buenahora Felicia | $157,429 |
Source: Public Records
Tax History Compared to Growth
Tax History
| Year | Tax Paid | Tax Assessment Tax Assessment Total Assessment is a certain percentage of the fair market value that is determined by local assessors to be the total taxable value of land and additions on the property. | Land | Improvement |
|---|---|---|---|---|
| 2024 | $2,554 | $21,059 | $2,711 | $18,348 |
| 2023 | $2,554 | $20,056 | $2,914 | $17,142 |
| 2022 | $2,455 | $19,100 | $3,172 | $15,928 |
| 2021 | $2,369 | $18,191 | $3,021 | $15,170 |
| 2020 | $2,206 | $17,325 | $3,326 | $13,999 |
| 2019 | $2,116 | $16,500 | $3,168 | $13,332 |
| 2018 | $2,130 | $16,500 | $3,168 | $13,332 |
| 2017 | $2,095 | $16,500 | $3,168 | $13,332 |
| 2016 | $2,147 | $16,500 | $3,168 | $13,332 |
| 2015 | $2,188 | $16,500 | $3,168 | $13,332 |
| 2014 | $2,237 | $16,500 | $3,168 | $13,332 |
Source: Public Records
Map
Nearby Homes
- 12209 S Ash Ave
- 12120 S Elm St
- 12102 S Elm St
- 320 W 130th Place S
- 11920 S Cedar Ave
- 322 W 126th St S
- 12534 S 1st St
- 124 W 126th St S
- 318 W 127th St S
- 626 W 120th St S
- 420 W 127th Place S
- 425 W 128th St S
- 515 W 128th St S
- 136 E 128th Place S
- 11920 S Holley St
- 12723 S 3rd St
- 12909 S 1st St
- 107 E 116th Place
- 11220 S Fir Ave
- 11212 S Fir Ave
- 12309 S Cedar Ave
- 12223 S Cedar Ave
- 12313 S Cedar Ave
- 12230 S Ash Ave
- 12306 S Ash Ave
- 12224 S Ash Ave
- 12312 S Ash Ave
- 12317 S Cedar Ave
- 12218 S Ash Ave
- 12211 S Cedar Ave
- 12230 S Cedar Ave
- 12302 S Cedar Ave
- 12308 S Cedar Ave
- 12224 S Cedar Ave
- 12318 S Ash Ave
- 12314 S Cedar Ave
- 12205 S Cedar Ave
- 12130 S Birch Ave
- 12321 S Cedar Ave
- 12124 S Birch Ave