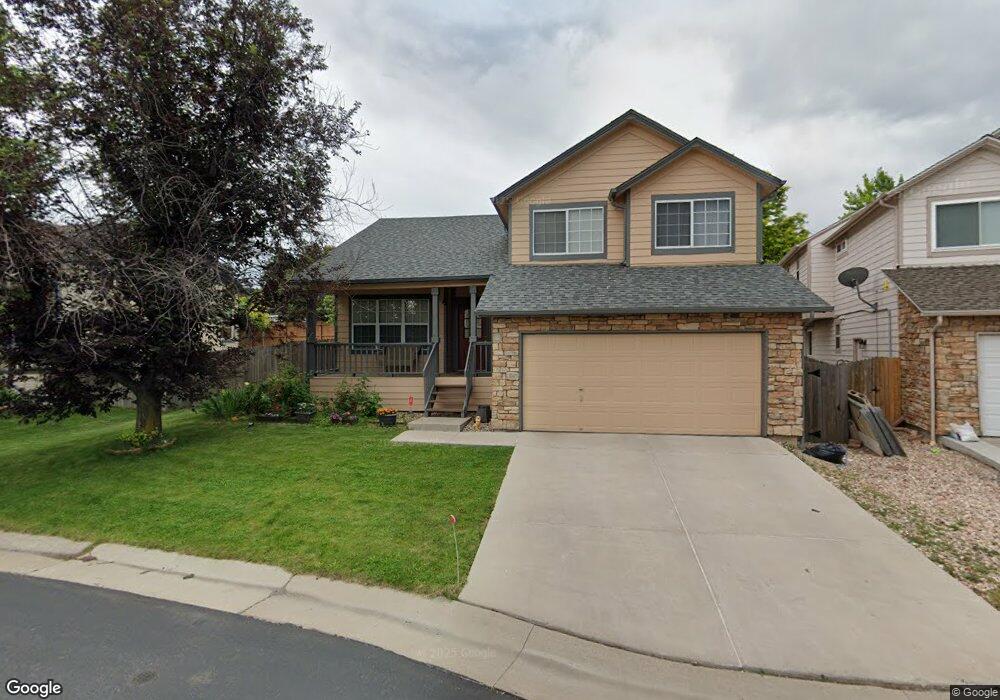
12229 W Chenango Dr Morrison, CO 80465
Friendly Hills NeighborhoodEstimated Value: $592,870 - $699,000
3
Beds
3
Baths
2,275
Sq Ft
$277/Sq Ft
Est. Value
About This Home
This home is located at 12229 W Chenango Dr, Morrison, CO 80465 and is currently estimated at $629,718, approximately $276 per square foot. 12229 W Chenango Dr is a home located in Jefferson County with nearby schools including Kendallvue Elementary School, Carmody Middle School, and Bear Creek High School.
Ownership History
Date
Name
Owned For
Owner Type
Purchase Details
Closed on
Sep 9, 2016
Sold by
Lee Peter Y and Lee Jean H
Bought by
Burke Stephen F and Burke Sharon T
Current Estimated Value
Home Financials for this Owner
Home Financials are based on the most recent Mortgage that was taken out on this home.
Original Mortgage
$396,239
Outstanding Balance
$316,704
Interest Rate
3.45%
Mortgage Type
VA
Estimated Equity
$313,014
Purchase Details
Closed on
Jul 29, 1994
Sold by
Essex Homes Inc
Bought by
Lee Peter Y and Lee Jean H
Home Financials for this Owner
Home Financials are based on the most recent Mortgage that was taken out on this home.
Original Mortgage
$113,240
Interest Rate
8.45%
Purchase Details
Closed on
Apr 28, 1994
Sold by
Trappers View Inc
Bought by
Essex Homes Inc
Home Financials for this Owner
Home Financials are based on the most recent Mortgage that was taken out on this home.
Original Mortgage
$107,154
Interest Rate
8.03%
Mortgage Type
Construction
Create a Home Valuation Report for This Property
The Home Valuation Report is an in-depth analysis detailing your home's value as well as a comparison with similar homes in the area
Home Values in the Area
Average Home Value in this Area
Purchase History
| Date | Buyer | Sale Price | Title Company |
|---|---|---|---|
| Burke Stephen F | $387,900 | Stewart Title | |
| Lee Peter Y | $142,900 | -- | |
| Essex Homes Inc | $16,000 | -- |
Source: Public Records
Mortgage History
| Date | Status | Borrower | Loan Amount |
|---|---|---|---|
| Open | Burke Stephen F | $396,239 | |
| Previous Owner | Lee Peter Y | $113,240 | |
| Previous Owner | Essex Homes Inc | $107,154 | |
| Closed | Essex Homes Inc | $12,000 |
Source: Public Records
Tax History
| Year | Tax Paid | Tax Assessment Tax Assessment Total Assessment is a certain percentage of the fair market value that is determined by local assessors to be the total taxable value of land and additions on the property. | Land | Improvement |
|---|---|---|---|---|
| 2024 | $3,752 | $37,523 | $7,602 | $29,921 |
| 2023 | $3,675 | $37,523 | $7,602 | $29,921 |
| 2022 | $3,161 | $31,067 | $6,456 | $24,611 |
| 2021 | $3,199 | $31,962 | $6,642 | $25,320 |
| 2020 | $2,827 | $28,329 | $5,082 | $23,247 |
| 2019 | $2,798 | $28,329 | $5,082 | $23,247 |
| 2018 | $2,394 | $23,435 | $5,324 | $18,111 |
| 2017 | $2,187 | $23,435 | $5,324 | $18,111 |
| 2016 | $1,415 | $22,578 | $5,695 | $16,883 |
| 2015 | $717 | $22,578 | $5,695 | $16,883 |
| 2014 | $1,954 | $18,922 | $4,594 | $14,328 |
Source: Public Records
Map
Nearby Homes
- 12271 W Chenango Dr
- 11815 W Belleview Dr
- 4800 S Tabor St
- 4726 S Taft St
- 4798 S Xenophon St
- 15425 W Columbia Ave
- 12196 W Belleview Dr
- 5021 S Robb St
- 11858 W Marlowe Ave
- 5026 S Robb St
- 11487 W Grand Way
- 4816 S Zang Way
- 11424 W Belleview Dr
- 11200 W Tanforan Cir
- 4742 S Routt Ct
- 5099 S Robb St
- 5383 S Urban Ct
- 12558 W Prentice Dr
- 11747 W Tufts Place
- 5396 S Xenon St
- 12231 W Chenango Dr
- 12219 W Chenango Dr
- 12235 W Chenango Dr
- 12215 W Chenango Dr
- 12245 W Chenango Dr
- 12239 W Chenango Dr
- 12227 W Chenango Dr
- 4948 S Van Gordon St
- 12221 W Chenango Dr
- 12241 W Chenango Dr
- 4949 S Van Gordon St
- 12205 W Chenango Dr
- 4947 S Urban Ct
- 12297 W Chenango Dr
- 12293 W Chenango Dr
- 12211 W Chenango Dr
- 4958 S Van Gordon St
- 12291 W Chenango Dr
- 4959 S Van Gordon St
- 12252 W Chenango Dr
Your Personal Tour Guide
Ask me questions while you tour the home.