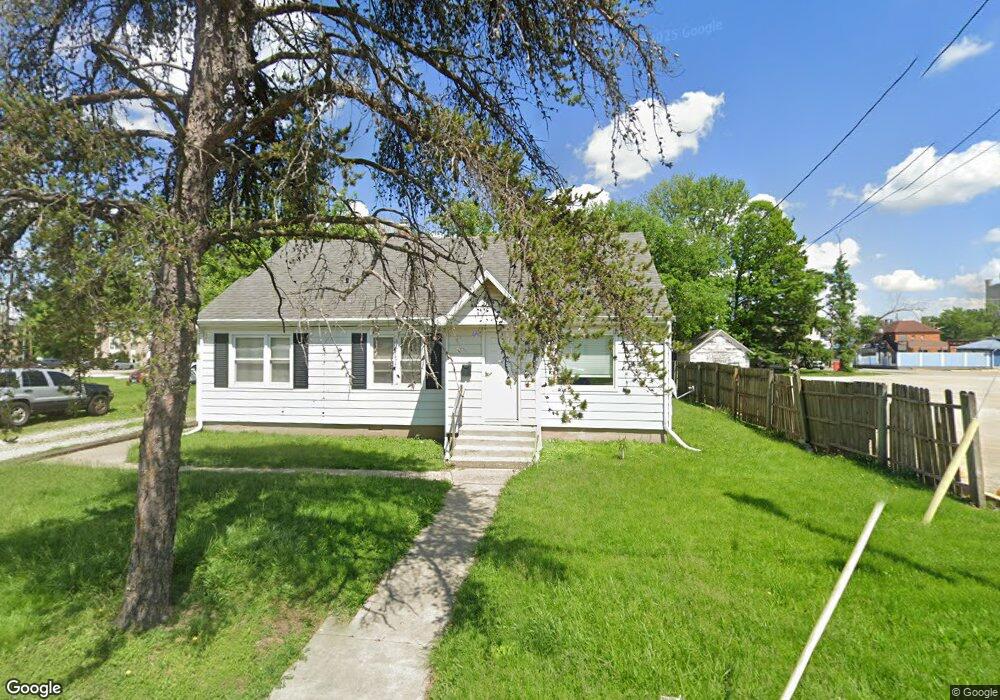
1223 3rd St Charleston, IL 61920
Estimated Value: $99,201 - $129,000
4
Beds
2
Baths
1,500
Sq Ft
$73/Sq Ft
Est. Value
About This Home
This home is located at 1223 3rd St, Charleston, IL 61920 and is currently estimated at $109,050, approximately $72 per square foot. 1223 3rd St is a home located in Coles County with nearby schools including Charleston High School and Charleston Christian Academy.
Ownership History
Date
Name
Owned For
Owner Type
Purchase Details
Closed on
Mar 29, 2018
Sold by
First Bank & Trust
Bought by
Hortenstine Properties Llc
Current Estimated Value
Home Financials for this Owner
Home Financials are based on the most recent Mortgage that was taken out on this home.
Original Mortgage
$131,485
Outstanding Balance
$77,261
Interest Rate
4.43%
Mortgage Type
New Conventional
Estimated Equity
$31,789
Purchase Details
Closed on
Jul 25, 2007
Sold by
Ricci John and Ricci Donna
Bought by
B K Lee Inc
Home Financials for this Owner
Home Financials are based on the most recent Mortgage that was taken out on this home.
Original Mortgage
$944,147
Interest Rate
6.69%
Mortgage Type
Purchase Money Mortgage
Create a Home Valuation Report for This Property
The Home Valuation Report is an in-depth analysis detailing your home's value as well as a comparison with similar homes in the area
Home Values in the Area
Average Home Value in this Area
Purchase History
| Date | Buyer | Sale Price | Title Company |
|---|---|---|---|
| Hortenstine Properties Llc | $146,500 | -- | |
| B K Lee Inc | $1,125,675 | None Available |
Source: Public Records
Mortgage History
| Date | Status | Borrower | Loan Amount |
|---|---|---|---|
| Open | Hortenstine Properties Llc | $131,485 | |
| Previous Owner | B K Lee Inc | $944,147 |
Source: Public Records
Tax History
| Year | Tax Paid | Tax Assessment Tax Assessment Total Assessment is a certain percentage of the fair market value that is determined by local assessors to be the total taxable value of land and additions on the property. | Land | Improvement |
|---|---|---|---|---|
| 2024 | $1,861 | $23,978 | $5,563 | $18,415 |
| 2023 | $1,836 | $21,897 | $5,080 | $16,817 |
| 2022 | $1,836 | $21,535 | $4,996 | $16,539 |
| 2021 | $1,891 | $20,667 | $4,795 | $15,872 |
| 2020 | $1,925 | $21,413 | $5,780 | $15,633 |
| 2019 | $1,893 | $20,667 | $5,579 | $15,088 |
| 2018 | $1,873 | $20,667 | $5,579 | $15,088 |
| 2017 | $2,293 | $25,633 | $5,579 | $20,054 |
| 2016 | $2,273 | $25,633 | $5,579 | $20,054 |
| 2015 | $2,358 | $25,633 | $5,579 | $20,054 |
| 2014 | $2,358 | $25,757 | $5,579 | $20,178 |
| 2013 | $2,358 | $25,757 | $5,579 | $20,178 |
Source: Public Records
Map
Nearby Homes
Your Personal Tour Guide
Ask me questions while you tour the home.