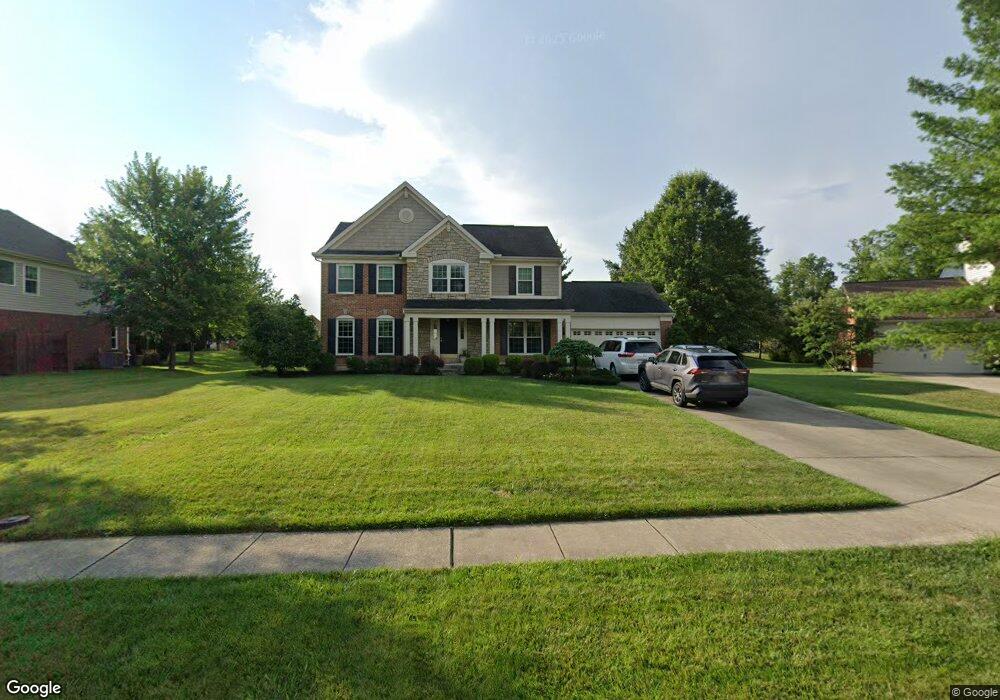
1223 Colonel Clopp Ct Loveland, OH 45140
Outer Loveland NeighborhoodEstimated Value: $437,158 - $485,000
4
Beds
3
Baths
2,046
Sq Ft
$227/Sq Ft
Est. Value
About This Home
This home is located at 1223 Colonel Clopp Ct, Loveland, OH 45140 and is currently estimated at $465,290, approximately $227 per square foot. 1223 Colonel Clopp Ct is a home located in Clermont County with nearby schools including Milford Senior High School, Milford Christian Academy, and St. Andrew - St. Elizabeth Ann Seton School.
Ownership History
Date
Name
Owned For
Owner Type
Purchase Details
Closed on
May 6, 2005
Sold by
Mclaughlin Robert C and Mclaughlin Lori J
Bought by
Kroger Joseph M and Broderick Anne M
Current Estimated Value
Home Financials for this Owner
Home Financials are based on the most recent Mortgage that was taken out on this home.
Original Mortgage
$198,400
Outstanding Balance
$105,367
Interest Rate
6.13%
Mortgage Type
Purchase Money Mortgage
Estimated Equity
$359,923
Purchase Details
Closed on
Feb 28, 2001
Sold by
Drees Co
Bought by
Mclaughlin Robert C and Mclaughlin Lori J
Home Financials for this Owner
Home Financials are based on the most recent Mortgage that was taken out on this home.
Original Mortgage
$181,000
Interest Rate
7.06%
Mortgage Type
New Conventional
Purchase Details
Closed on
Mar 3, 1997
Sold by
Bramblewood Dev Inc
Bought by
Drees Co
Create a Home Valuation Report for This Property
The Home Valuation Report is an in-depth analysis detailing your home's value as well as a comparison with similar homes in the area
Home Values in the Area
Average Home Value in this Area
Purchase History
| Date | Buyer | Sale Price | Title Company |
|---|---|---|---|
| Kroger Joseph M | $248,000 | Advanced Land Title Agency L | |
| Mclaughlin Robert C | $211,000 | -- | |
| Drees Co | $163,600 | -- |
Source: Public Records
Mortgage History
| Date | Status | Borrower | Loan Amount |
|---|---|---|---|
| Open | Kroger Joseph M | $198,400 | |
| Previous Owner | Mclaughlin Robert C | $181,000 |
Source: Public Records
Tax History Compared to Growth
Tax History
| Year | Tax Paid | Tax Assessment Tax Assessment Total Assessment is a certain percentage of the fair market value that is determined by local assessors to be the total taxable value of land and additions on the property. | Land | Improvement |
|---|---|---|---|---|
| 2024 | $5,146 | $110,220 | $26,600 | $83,620 |
| 2023 | $5,198 | $110,220 | $26,600 | $83,620 |
| 2022 | $5,080 | $81,870 | $19,780 | $62,090 |
| 2021 | $5,085 | $81,870 | $19,780 | $62,090 |
| 2020 | $4,879 | $81,870 | $19,780 | $62,090 |
| 2019 | $5,358 | $85,720 | $19,670 | $66,050 |
| 2018 | $5,340 | $85,720 | $19,670 | $66,050 |
| 2017 | $5,243 | $85,720 | $19,670 | $66,050 |
| 2016 | $5,008 | $73,260 | $16,800 | $56,460 |
| 2015 | $4,798 | $73,260 | $16,800 | $56,460 |
| 2014 | $4,593 | $73,260 | $16,800 | $56,460 |
| 2013 | $4,514 | $69,830 | $17,500 | $52,330 |
Source: Public Records
Map
Nearby Homes
- 5933 Firm Stance Dr
- 1140 Weber Rd
- 2013 Weber Rd
- 1064 Weber Rd
- 1803 Wheatfield Way
- 6149 Century Farm Dr
- 6141 Brandywine Ct
- 1124 Clover Field Dr
- 1513 Charleston Ln
- 6379 Derbyshire Ln
- 1113 Clover Field Dr
- 6211 Spires Dr
- 6211 Cook Rd
- 6320 Ashford Dr
- 6108 Donna Jay Dr
- 6365 Ironwood Dr
- 6661 Paxton Guinea Rd
- 6077 Branch Hill Guinea Pike
- 1376 Barre Ln
- 6395 Barre Rd
- 1225 Colonel Clopp Ct
- 1221 Colonel Clopp Ct
- 1424 Return Shot Ln
- 1422 Return Shot Ln
- 1426 Return Shot Ln
- 1227 Colonel Clopp Ct
- 1219 Colonel Clopp Ct
- 1224 Colonel Clopp Ct
- 1220 Colonel Clopp Ct
- 1226 Colonel Clopp Ct
- 1229 Colonel Clopp Ct
- 1427 Return Shot Ln
- 1420 Return Shot Ln
- 1423 Return Shot Ln
- 1228 Colonel Clopp Ct
- 6320 Weber Woods Ct
- 6318 Weber Woods Ct
- 1323 Bedfordshire Dr
- 1325 Bedfordshire Dr
- 6316 Weber Woods Ct