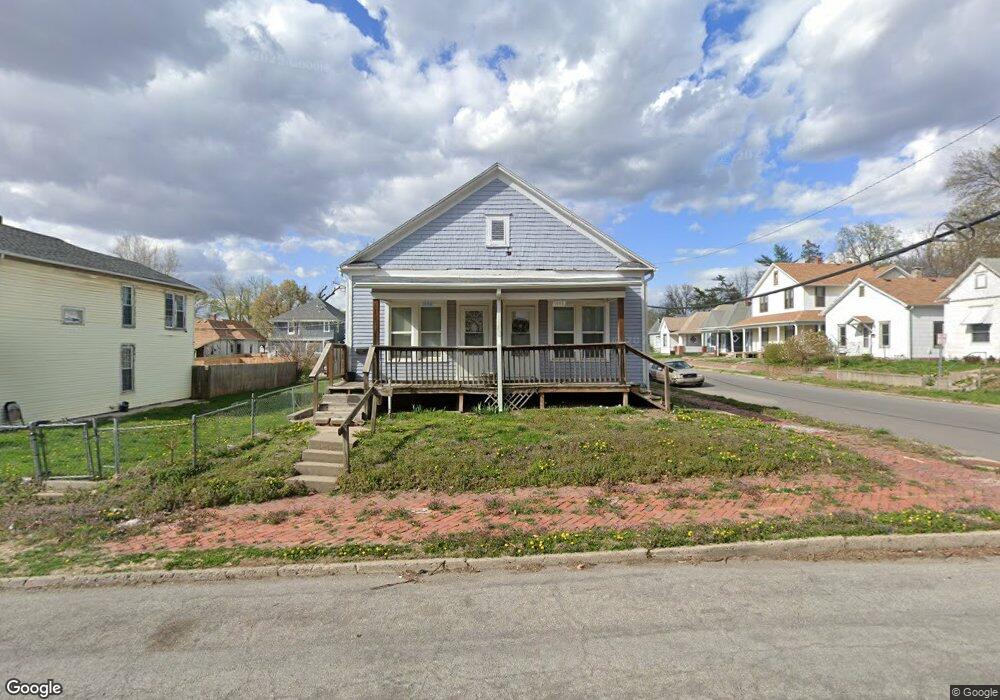
1223 Corby St Saint Joseph, MO 64501
Northside NeighborhoodEstimated Value: $111,000 - $156,000
Studio
--
Bath
1,776
Sq Ft
$70/Sq Ft
Est. Value
About This Home
This home is located at 1223 Corby St, Saint Joseph, MO 64501 and is currently estimated at $123,995, approximately $69 per square foot. 1223 Corby St is a home located in Buchanan County with nearby schools including Lindbergh Elementary School, Robidoux Middle School, and Lafayette High School.
Ownership History
Date
Name
Owned For
Owner Type
Purchase Details
Closed on
May 31, 2012
Sold by
Ts Kozeny & Mccubbin Lc
Bought by
Be Bank Of American Na
Current Estimated Value
Purchase Details
Closed on
Mar 14, 2005
Sold by
Reece Brandon D
Bought by
Goldizen Nicholas J and Goldizen Karia M
Home Financials for this Owner
Home Financials are based on the most recent Mortgage that was taken out on this home.
Original Mortgage
$42,400
Interest Rate
5.66%
Mortgage Type
New Conventional
Create a Home Valuation Report for This Property
The Home Valuation Report is an in-depth analysis detailing your home's value as well as a comparison with similar homes in the area
Home Values in the Area
Average Home Value in this Area
Purchase History
| Date | Buyer | Sale Price | Title Company |
|---|---|---|---|
| Be Bank Of American Na | $47,899 | None Available | |
| Goldizen Nicholas J | -- | Hall Abstract & Title Co Inc |
Source: Public Records
Mortgage History
| Date | Status | Borrower | Loan Amount |
|---|---|---|---|
| Previous Owner | Goldizen Nicholas J | $42,400 |
Source: Public Records
Tax History
| Year | Tax Paid | Tax Assessment Tax Assessment Total Assessment is a certain percentage of the fair market value that is determined by local assessors to be the total taxable value of land and additions on the property. | Land | Improvement |
|---|---|---|---|---|
| 2025 | $538 | $7,510 | $1,240 | $6,270 |
| 2024 | $437 | $6,090 | $1,240 | $4,850 |
| 2023 | $437 | $6,090 | $1,240 | $4,850 |
| 2022 | $39 | $6,090 | $1,240 | $4,850 |
| 2021 | $406 | $6,090 | $1,240 | $4,850 |
| 2020 | $403 | $6,090 | $1,240 | $4,850 |
| 2019 | $389 | $6,090 | $1,240 | $4,850 |
| 2018 | $352 | $6,090 | $1,240 | $4,850 |
| 2017 | $348 | $6,090 | $0 | $0 |
| 2015 | $340 | $6,090 | $0 | $0 |
| 2014 | $340 | $6,090 | $0 | $0 |
Source: Public Records
Map
Nearby Homes
- 1217 Corby St
- 1215 Corby St
- 1213 Corby St
- 905 N 13th St
- 1209 Corby St
- 907 N 13th St
- 822 N 13th St
- 822 N 13th St Unit 822 N 13th Unit 2
- 901 N 13th St
- 1224 Powell St
- 1222 Powell St
- 1220 Powell St
- 909 N 13th St
- 1218 Powell St
- 820 N 13 St
- 1214 Corby St
- 1205 Corby St
- 820 N 13th St
- 917 N 13 St
- 821 N 13th St
Your Personal Tour Guide
Ask me questions while you tour the home.