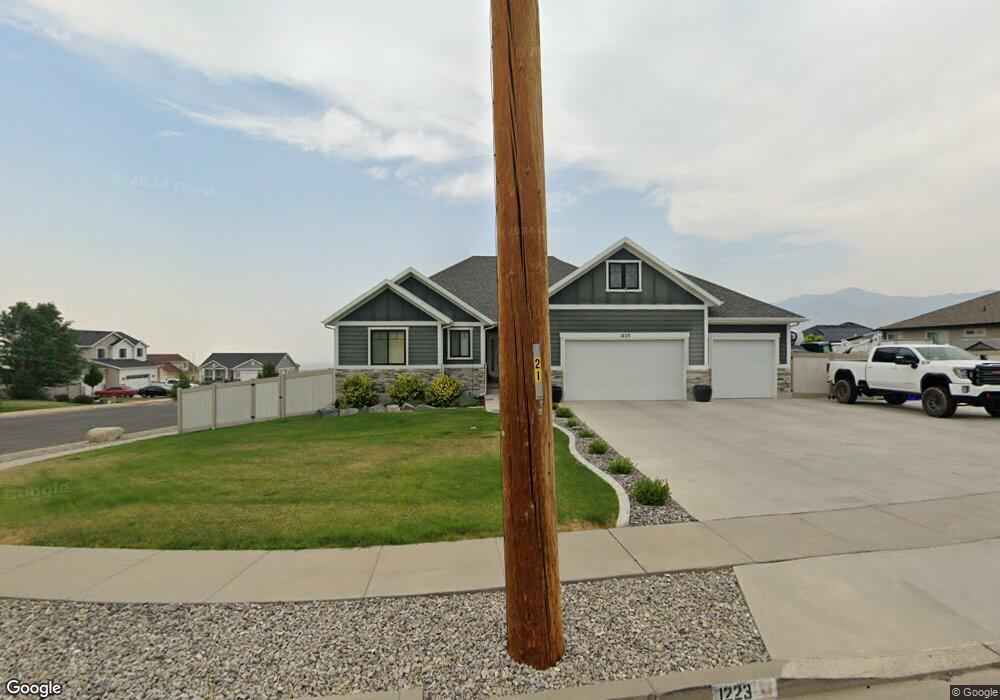
1223 E 270 S Tooele, UT 84074
Estimated Value: $641,689 - $761,000
3
Beds
3
Baths
3,824
Sq Ft
$182/Sq Ft
Est. Value
About This Home
This home is located at 1223 E 270 S, Tooele, UT 84074 and is currently estimated at $694,422, approximately $181 per square foot. 1223 E 270 S is a home located in Tooele County with nearby schools including Sterling Elementary School, Tooele Junior High School, and Tooele High School.
Ownership History
Date
Name
Owned For
Owner Type
Purchase Details
Closed on
Dec 16, 2021
Sold by
Jones Houston and Jones Danzie
Bought by
Jones Danzie and Jones Houston
Current Estimated Value
Home Financials for this Owner
Home Financials are based on the most recent Mortgage that was taken out on this home.
Original Mortgage
$520,000
Outstanding Balance
$478,135
Interest Rate
3.09%
Mortgage Type
New Conventional
Estimated Equity
$216,287
Purchase Details
Closed on
Mar 27, 2018
Sold by
Stansbury Homes Llc
Bought by
Jones Houston and Jones Danzie
Home Financials for this Owner
Home Financials are based on the most recent Mortgage that was taken out on this home.
Original Mortgage
$349,600
Interest Rate
4.38%
Mortgage Type
New Conventional
Purchase Details
Closed on
Jun 27, 2017
Sold by
Loma Vista Llc
Bought by
Stansbury Homes Llc
Create a Home Valuation Report for This Property
The Home Valuation Report is an in-depth analysis detailing your home's value as well as a comparison with similar homes in the area
Purchase History
| Date | Buyer | Sale Price | Title Company |
|---|---|---|---|
| Jones Danzie | -- | Security Title Ins Agcy Of | |
| Jones Houston | -- | Inwest Title Tooele Office | |
| Stansbury Homes Llc | -- | Founders Title Company |
Source: Public Records
Mortgage History
| Date | Status | Borrower | Loan Amount |
|---|---|---|---|
| Open | Jones Danzie | $520,000 | |
| Closed | Jones Houston | $349,600 |
Source: Public Records
Tax History
| Year | Tax Paid | Tax Assessment Tax Assessment Total Assessment is a certain percentage of the fair market value that is determined by local assessors to be the total taxable value of land and additions on the property. | Land | Improvement |
|---|---|---|---|---|
| 2025 | $4,122 | $625,153 | $116,800 | $508,353 |
| 2024 | $4,285 | $327,042 | $64,240 | $262,802 |
| 2023 | $4,285 | $317,741 | $61,248 | $256,493 |
| 2022 | $4,161 | $357,964 | $61,248 | $296,716 |
| 2021 | $3,264 | $234,869 | $31,350 | $203,519 |
| 2020 | $3,421 | $427,035 | $57,000 | $370,035 |
| 2019 | $3,142 | $385,836 | $71,250 | $314,586 |
| 2018 | $1,229 | $143,050 | $65,000 | $78,050 |
| 2017 | $658 | $50,000 | $50,000 | $0 |
| 2016 | $688 | $50,000 | $50,000 | $0 |
| 2015 | $688 | $50,000 | $0 | $0 |
| 2014 | -- | $50,000 | $0 | $0 |
Source: Public Records
Map
Nearby Homes
- 247 S Droubay Rd
- 338 S 1230 E
- 1317 E 270 S
- 265 E Serenity Ave Unit 1004
- 1918 N Patchwork Ave
- 405 Vela Ct
- 1416 E 270 S
- 11 Benchmark Village
- 379 S 1370 E
- 426 S Deer Hollow Dr
- 524 Oak Ln Unit 3
- 558 Oak Ln
- 34 Benchmark Village
- 446 Bevan Way
- 729 Crestview Dr
- 607 Haylie Ln
- 584 S Oak Ln
- 614 Oak Ct Unit 13
- 828 E Vine St
- 454 S Corner View Dr
- 1223 E 270 S Unit 1
- 1223 E 270 S Unit 1&2
- 1237 E 270 S Unit 2
- 1224 E 240 S
- 1224 E 240 S Unit 106
- 1212 E 240 S Unit 107
- 1236 E 240 S Unit 105
- 288 S 1230 E
- 1216 E 270 S
- 288 S 1230 E Unit 58
- 1249 E 270 S Unit 3
- 888 E 240 S
- 888 E 240 S Unit 207
- 283 S 1230 E
- 255 S Droubay Rd Unit 1
- 265 S Droubay Rd Unit 2
- 255 S Droubay Rd Unit 1
- 255 S Droubay Rd
- 265 S Droubay Rd Unit 2
- 265 S Droubay Rd
Your Personal Tour Guide
Ask me questions while you tour the home.