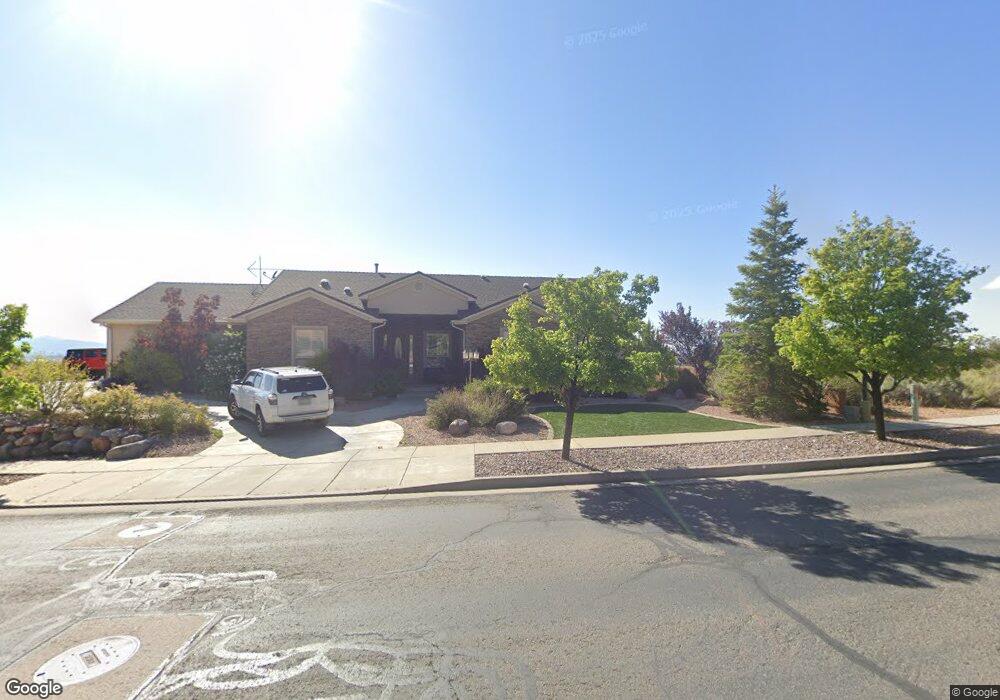
1223 Knoll St Cedar City, UT 84721
Estimated Value: $979,648 - $1,140,000
5
Beds
4
Baths
5,383
Sq Ft
$193/Sq Ft
Est. Value
About This Home
This home is located at 1223 Knoll St, Cedar City, UT 84721 and is currently estimated at $1,040,549, approximately $193 per square foot. 1223 Knoll St is a home located in Iron County with nearby schools including Fiddlers Canyon School, Canyon View Middle School, and Canyon View High School.
Ownership History
Date
Name
Owned For
Owner Type
Purchase Details
Closed on
Jul 7, 2025
Sold by
Arnold Layne B and Arnold Jennifer A
Bought by
Layne B And Jennifer A Arnold Family Trust and Arnold
Current Estimated Value
Purchase Details
Closed on
Oct 26, 2020
Sold by
Taggart Judith Gail and Taggart Richard H
Bought by
Arnold Jennifer A and Arnold Layne B
Home Financials for this Owner
Home Financials are based on the most recent Mortgage that was taken out on this home.
Original Mortgage
$483,000
Interest Rate
2.9%
Mortgage Type
New Conventional
Purchase Details
Closed on
Jun 5, 2009
Sold by
Taggart Family Ltd Pa
Bought by
Taggart Richard H and Taggart Judith Gail
Home Financials for this Owner
Home Financials are based on the most recent Mortgage that was taken out on this home.
Original Mortgage
$351,000
Interest Rate
4.76%
Mortgage Type
New Conventional
Purchase Details
Closed on
Oct 3, 2005
Sold by
Ns Canyon Ridge Llc
Bought by
Taggart Family Lp
Create a Home Valuation Report for This Property
The Home Valuation Report is an in-depth analysis detailing your home's value as well as a comparison with similar homes in the area
Home Values in the Area
Average Home Value in this Area
Purchase History
| Date | Buyer | Sale Price | Title Company |
|---|---|---|---|
| Layne B And Jennifer A Arnold Family Trust | -- | None Listed On Document | |
| Layne B And Jennifer A Arnold Family Trust | -- | None Listed On Document | |
| Arnold Jennifer A | -- | Inwest Title Svcs St George | |
| Taggart Richard H | -- | -- | |
| Taggart Family Lp | -- | -- |
Source: Public Records
Mortgage History
| Date | Status | Borrower | Loan Amount |
|---|---|---|---|
| Previous Owner | Arnold Jennifer A | $483,000 | |
| Previous Owner | Taggart Richard H | $351,000 |
Source: Public Records
Tax History Compared to Growth
Tax History
| Year | Tax Paid | Tax Assessment Tax Assessment Total Assessment is a certain percentage of the fair market value that is determined by local assessors to be the total taxable value of land and additions on the property. | Land | Improvement |
|---|---|---|---|---|
| 2025 | $4,041 | $519,600 | $59,459 | $460,141 |
| 2023 | $4,019 | $517,850 | $67,570 | $450,280 |
| 2022 | $3,662 | $398,345 | $51,975 | $346,370 |
| 2021 | $3,256 | $354,205 | $38,500 | $315,705 |
| 2020 | $3,044 | $293,560 | $38,500 | $255,060 |
| 2019 | $3,000 | $276,810 | $38,500 | $238,310 |
| 2018 | $2,980 | $265,970 | $38,500 | $227,470 |
| 2017 | $2,962 | $260,290 | $38,500 | $221,790 |
| 2016 | $2,812 | $230,065 | $29,055 | $201,010 |
| 2015 | $2,444 | $189,640 | $0 | $0 |
| 2014 | $2,406 | $174,600 | $0 | $0 |
Source: Public Records
Map
Nearby Homes
- 1472 N Knoll St
- 481 E Canyon View Dr
- 412 E 1250 N
- 1205 N Fairview Dr
- 1205 N Fairview Dr Unit 58
- 1419 N Knoll St
- Lot 21 E Canyon Ridge Dr Unit 4
- 1471 N Knoll St Unit 44
- 1471 N Knoll St
- 811 Canyon Ridge Dr
- 1490 N Knoll St Unit 7
- 1490 N Knoll St
- 1406 S N Fairway Dr
- 1509 N Knoll St
- 1528 N Knoll St
- 279 E Cedar Ridge Cir Unit Lot 11
- 279 E Cedar Ridge Cir
- 280 E Cedar Ridge Cir Unit Lot 1
- 368 E Cedar Ridge Cir
- 315 E Cedar Ridge Cir Unit 9
- 1223 Knoll St
- 1243 N Knoll St Unit 2
- 1243 N Knoll St
- 1242 Knoll St
- 1242 N Knoll St
- 1267 N Knoll St Unit 30
- 1267 N Knoll St
- 1268 N Knoll St
- 2358 N Wanser Ln
- 595 E 1225 Cir N Unit CIR
- 595 E 1225 Cir N
- 1277 N Knoll St Unit 2
- 1277 N Knoll St
- 1254 N Ridgeway Dr
- 528 E 1250 N
- 588 E 1275 N
- 598 E 1275 Cir N
- 598 E 1275 Cir N Unit Dr.
- 598 E 1275 Cir N Unit CIR
- 1270 N Ridgeway Dr