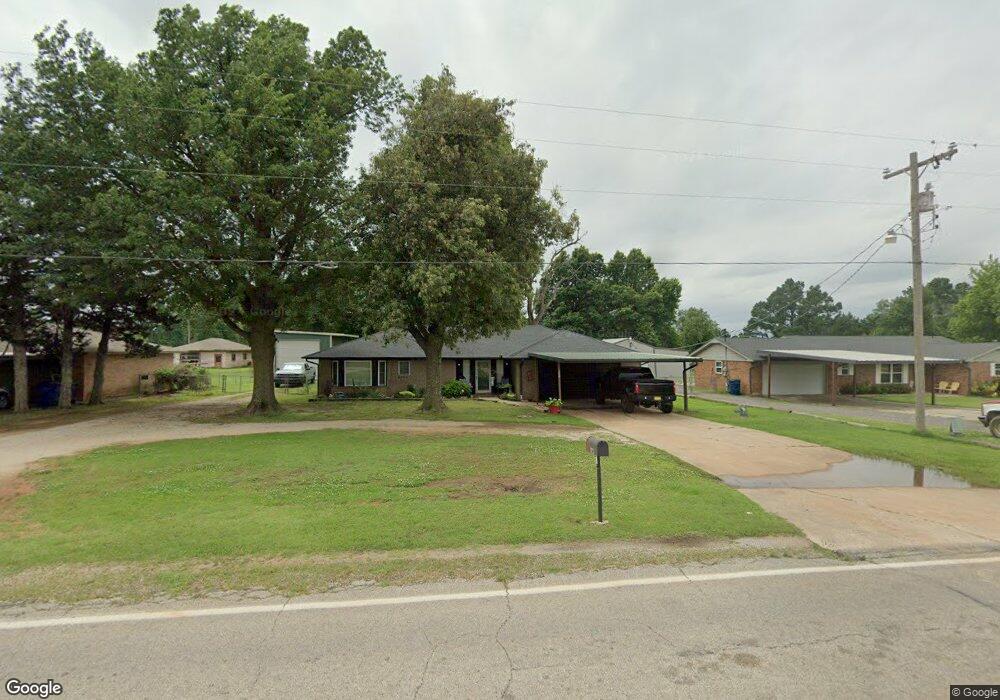
1223 N Peebly Rd Choctaw, OK 73020
Estimated Value: $259,000 - $307,000
2
Beds
2
Baths
1,826
Sq Ft
$151/Sq Ft
Est. Value
About This Home
This home is located at 1223 N Peebly Rd, Choctaw, OK 73020 and is currently estimated at $275,242, approximately $150 per square foot. 1223 N Peebly Rd is a home located in Oklahoma County with nearby schools including Choctaw Elementary School, Choctaw Middle School, and Choctaw High School.
Ownership History
Date
Name
Owned For
Owner Type
Purchase Details
Closed on
Apr 21, 2011
Sold by
Fannie Mae
Bought by
Cummins Marcy J
Current Estimated Value
Home Financials for this Owner
Home Financials are based on the most recent Mortgage that was taken out on this home.
Original Mortgage
$85,877
Outstanding Balance
$59,441
Interest Rate
4.87%
Mortgage Type
New Conventional
Estimated Equity
$215,801
Purchase Details
Closed on
Aug 16, 2010
Sold by
Travis Suzanne K and Holt Cindy Sue
Bought by
Federal National Mortgage Association
Purchase Details
Closed on
Jun 30, 2006
Sold by
Delsigne Claudene J and Delsigne Emile D
Bought by
Travis Suzanne K
Home Financials for this Owner
Home Financials are based on the most recent Mortgage that was taken out on this home.
Original Mortgage
$116,100
Interest Rate
6.67%
Mortgage Type
Purchase Money Mortgage
Purchase Details
Closed on
Aug 26, 1999
Sold by
Delsigne Claudene J
Bought by
Delsigne Claudene J and Delsigne Emile D
Create a Home Valuation Report for This Property
The Home Valuation Report is an in-depth analysis detailing your home's value as well as a comparison with similar homes in the area
Home Values in the Area
Average Home Value in this Area
Purchase History
| Date | Buyer | Sale Price | Title Company |
|---|---|---|---|
| Cummins Marcy J | $90,000 | Firstitle & Abstract Service | |
| Federal National Mortgage Association | -- | None Available | |
| Travis Suzanne K | $129,000 | Lawyers Title Of Ok City Inc | |
| Delsigne Claudene J | -- | -- |
Source: Public Records
Mortgage History
| Date | Status | Borrower | Loan Amount |
|---|---|---|---|
| Open | Cummins Marcy J | $85,877 | |
| Previous Owner | Travis Suzanne K | $116,100 |
Source: Public Records
Tax History Compared to Growth
Tax History
| Year | Tax Paid | Tax Assessment Tax Assessment Total Assessment is a certain percentage of the fair market value that is determined by local assessors to be the total taxable value of land and additions on the property. | Land | Improvement |
|---|---|---|---|---|
| 2024 | $2,708 | $24,284 | $2,245 | $22,039 |
| 2023 | $2,708 | $23,128 | $2,155 | $20,973 |
| 2022 | $2,537 | $22,027 | $2,040 | $19,987 |
| 2021 | $2,341 | $20,350 | $2,206 | $18,144 |
| 2020 | $2,310 | $19,992 | $2,173 | $17,819 |
| 2019 | $2,203 | $19,040 | $2,058 | $16,982 |
| 2018 | $2,101 | $18,134 | $0 | $0 |
| 2017 | $1,995 | $17,269 | $2,055 | $15,214 |
| 2016 | $2,042 | $17,599 | $2,055 | $15,544 |
| 2015 | $1,978 | $17,051 | $2,010 | $15,041 |
| 2014 | $1,882 | $16,240 | $2,055 | $14,185 |
Source: Public Records
Map
Nearby Homes
- 1383 N Peebly Rd
- 18280 NE 10th St
- 895 Choctaw Vista
- 18320 NE 23rd St
- 1772 N Peebly Rd
- 17800 Piper Glen Dr
- 18465 NE 23rd St
- 18803 Marbella Ln
- 25 Woodlake Dr
- 17200 NE 23rd St
- 151 S Peebly Rd
- 0 Timber Ridge Dr
- 0 NE 23rd St Unit 1182275
- 000 W Redbud Creek Cir
- 17771 Piper Glen Dr
- 680 Silver Tree Dr
- 19297 NE 23rd St
- 16601 NE 23rd St
- 0 E Reno & Luther Rd Unit 1158337
- 16470 Shelby St
- 1237 N Peebly Rd
- 1201 N Peebly Rd
- 1265 N Peebly Rd
- 1159 N Peebly Rd
- 1293 N Peebly Rd
- 1131 N Peebly Rd
- 17924 NE 12th St
- 17945 NE 10th St
- 17906 NE 12th St
- 17925 NE 10th St
- 17909 NE 10th St
- 17886 NE 12th St
- 1333 N Peebly Rd
- 17887 NE 10th St
- 17868 NE 12th St
- 17869 NE 10th St
- 17850 NE 12th St
- 17907 NE 12th St
- 17871 NE 12th St
- 1059 N Peebly Rd