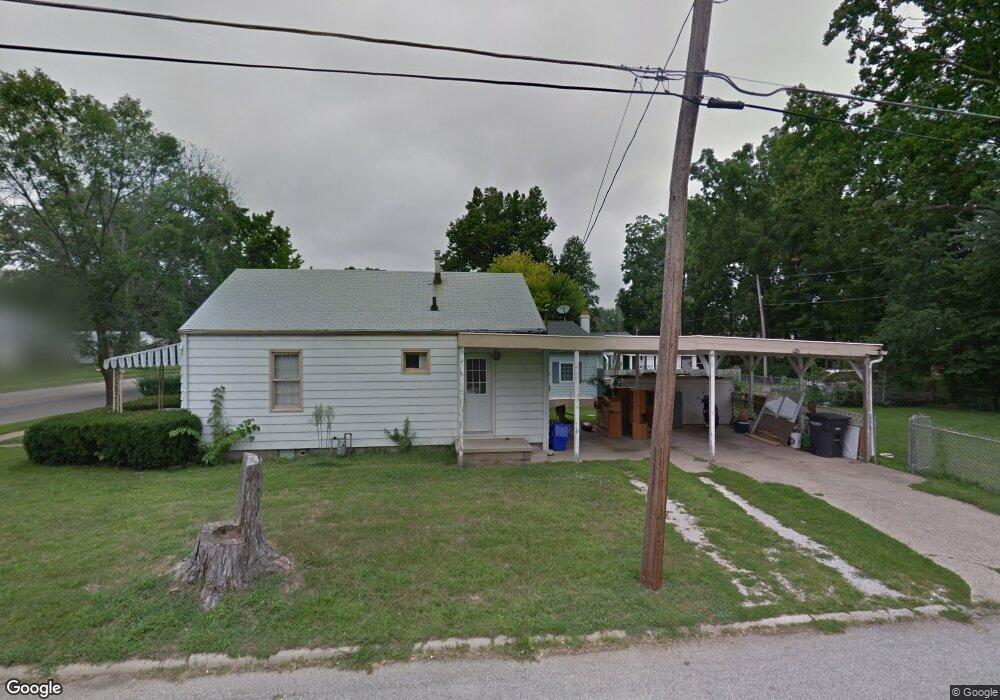
1223 S 18th St Lafayette, IN 47905
South Oakland NeighborhoodEstimated Value: $162,000 - $176,000
2
Beds
1
Bath
672
Sq Ft
$250/Sq Ft
Est. Value
About This Home
This home is located at 1223 S 18th St, Lafayette, IN 47905 and is currently estimated at $167,941, approximately $249 per square foot. 1223 S 18th St is a home located in Tippecanoe County with nearby schools including Oakland Elementary School, Lafayette Tecumseh Junior High School, and Sunnyside Intermediate School.
Ownership History
Date
Name
Owned For
Owner Type
Purchase Details
Closed on
Apr 2, 2010
Sold by
Randolph Jeremiah S
Bought by
Cathy Russell Rentals Inc
Current Estimated Value
Purchase Details
Closed on
Apr 13, 2005
Sold by
Dottle William Lee and Dottle Sandra S
Bought by
Cathy Russell Rentals Inc
Home Financials for this Owner
Home Financials are based on the most recent Mortgage that was taken out on this home.
Original Mortgage
$60,000
Interest Rate
5.88%
Mortgage Type
Purchase Money Mortgage
Create a Home Valuation Report for This Property
The Home Valuation Report is an in-depth analysis detailing your home's value as well as a comparison with similar homes in the area
Home Values in the Area
Average Home Value in this Area
Purchase History
| Date | Buyer | Sale Price | Title Company |
|---|---|---|---|
| Cathy Russell Rentals Inc | -- | -- | |
| Randolph Jeremiah S | -- | None Available | |
| Cathy Russell Rentals Inc | -- | -- |
Source: Public Records
Mortgage History
| Date | Status | Borrower | Loan Amount |
|---|---|---|---|
| Previous Owner | Cathy Russell Rentals Inc | $60,000 |
Source: Public Records
Tax History Compared to Growth
Tax History
| Year | Tax Paid | Tax Assessment Tax Assessment Total Assessment is a certain percentage of the fair market value that is determined by local assessors to be the total taxable value of land and additions on the property. | Land | Improvement |
|---|---|---|---|---|
| 2024 | $2,208 | $110,100 | $24,000 | $86,100 |
| 2023 | $1,539 | $76,700 | $24,000 | $52,700 |
| 2022 | $1,401 | $69,700 | $24,000 | $45,700 |
| 2021 | $1,325 | $65,800 | $24,000 | $41,800 |
| 2020 | $1,227 | $60,900 | $24,000 | $36,900 |
| 2019 | $1,204 | $59,700 | $18,800 | $40,900 |
| 2018 | $1,161 | $57,500 | $18,800 | $38,700 |
| 2017 | $1,155 | $57,200 | $18,800 | $38,400 |
| 2016 | $1,138 | $56,500 | $18,800 | $37,700 |
| 2014 | $1,130 | $56,100 | $18,800 | $37,300 |
| 2013 | $273 | $55,000 | $18,800 | $36,200 |
Source: Public Records
Map
Nearby Homes
- 1639 Stanforth Ave
- 1334 El Prado Ave
- 1501 El Prado Ave
- 1226 Sinton Ave
- 2109 Central St
- 1310 Sinton Ave
- 1501 Franklin St
- 1111 S 14th St
- 815 S 19th St
- 807 S 20th St
- 1214 King St
- 1309 S 23rd St
- 1204 Central St
- 708 S 20th St
- 1304 S 25th St
- 1406 Virginia St
- 626 S 21st St
- 622 S 21st St
- 1108 Potomac Ave
- 802 S 12th St