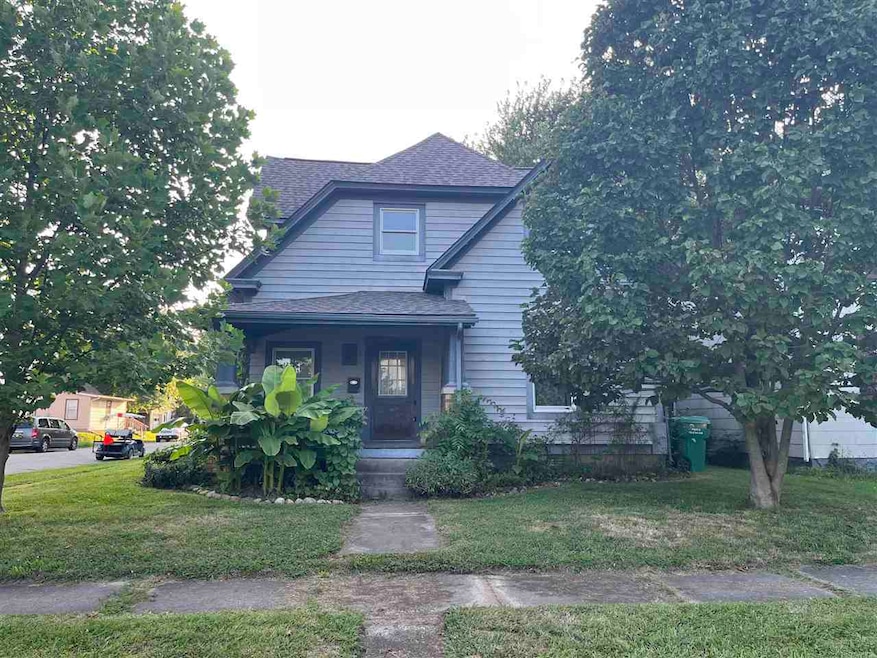
1223 S 21st St New Castle, IN 47362
Estimated payment $947/month
Highlights
- Main Floor Bedroom
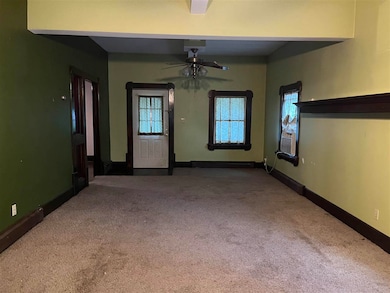
- Living Room
- Bathroom on Main Level
- Covered Patio or Porch
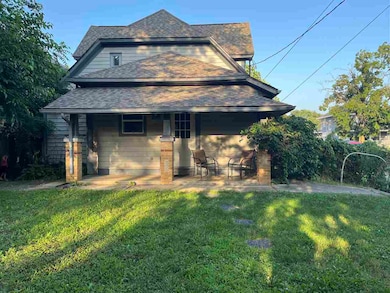
- Bungalow
- Forced Air Heating System
About This Home
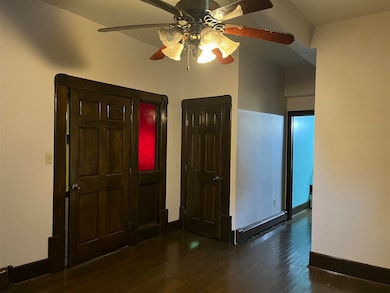
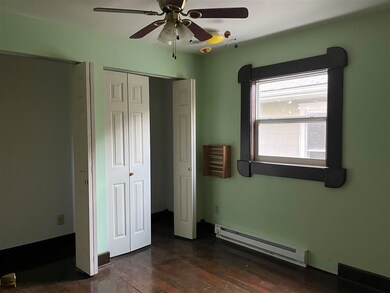
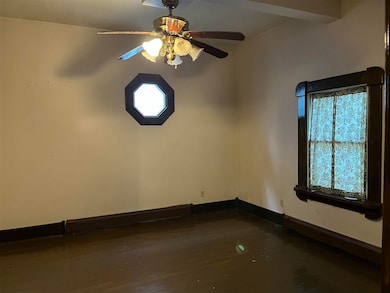
Welcome to this single-family home offering, comfort, space, and convenience. Nestled in a peaceful neighborhood, this home features four generously sized bedrooms, perfect for small families, downsizers, or first-time buyers. Enjoy the expansive living area ideal for entertaining or relaxing, plus a fully fenced backyard-great for pets, play, or gardening. Off-street parking adds ease and security. Don't miss this move-in ready gem that combines privacy and practicality! Text 1125835 to 35620 for more information and photos.
Listing Agent
Better Homes and Gardens First Realty Group License #RB22001126 Listed on: 07/28/2025

Home Details
Home Type
- Single Family
Est. Annual Taxes
- $926
Year Built
- Built in 1975
Lot Details
- Lot Dimensions are 40x132
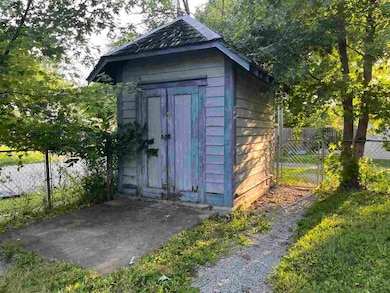
- Chain Link Fence
Home Design
- Bungalow
- Shingle Roof
- Wood Siding
- Stick Built Home
Interior Spaces
- 1,956 Sq Ft Home
- 1.5-Story Property
- Window Treatments
- Living Room
- Utility Room
- Washer and Dryer
- Gas Range
- Basement
Bedrooms and Bathrooms
- 4 Bedrooms
- Main Floor Bedroom
- Bathroom on Main Level
Outdoor Features
- Covered Patio or Porch
Schools
- Henry County Elementary And Middle School
- Henry County High School
Utilities
- Two Cooling Systems Mounted To A Wall/Window
- Window Unit Cooling System
- Forced Air Heating System
- Heating System Uses Gas
- Electric Water Heater
- Cable TV Available
Map
Home Values in the Area
Average Home Value in this Area
Tax History
| Year | Tax Paid | Tax Assessment Tax Assessment Total Assessment is a certain percentage of the fair market value that is determined by local assessors to be the total taxable value of land and additions on the property. | Land | Improvement |
|---|---|---|---|---|
| 2024 | $926 | $92,600 | $9,400 | $83,200 |
| 2023 | $711 | $79,600 | $9,400 | $70,200 |
| 2022 | $624 | $68,700 | $6,300 | $62,400 |
| 2021 | $541 | $59,500 | $6,300 | $53,200 |
| 2020 | $590 | $60,700 | $6,300 | $54,400 |
| 2019 | $554 | $58,600 | $6,300 | $52,300 |
| 2018 | $499 | $56,600 | $5,700 | $50,900 |
| 2017 | $464 | $55,900 | $5,700 | $50,200 |
| 2016 | $555 | $65,400 | $6,700 | $58,700 |
| 2014 | $472 | $68,700 | $8,300 | $60,400 |
| 2013 | $472 | $66,000 | $8,300 | $57,700 |
Property History
| Date | Event | Price | List to Sale | Price per Sq Ft |
|---|---|---|---|---|
| 07/28/2025 07/28/25 | For Sale | $165,000 | -- | $84 / Sq Ft |
Purchase History
| Date | Type | Sale Price | Title Company |
|---|---|---|---|
| Warranty Deed | -- | Title Express Inc | |
| Special Warranty Deed | -- | Statewide Title Company Inc | |
| Sheriffs Deed | $36,767 | None Available |
Mortgage History
| Date | Status | Loan Amount | Loan Type |
|---|---|---|---|
| Open | $63,352 | FHA |
Source: Richmond Association of REALTORS®
MLS Number: 10051682
APN: 33-12-14-320-294.000-016
- 1218 S 18th St Unit 2
- 1311 S 17th St
- 1628 A Ave
- 921 S 14th St Unit Half
- 509 S 18th St
- 701 S 14th St Unit 3A
- 2225 Broad St
- 302 S 12th St Unit 7
- 211 N 17th St Unit 2
- 925 Broad St Unit .5
- 2120 Spring St
- 228 N 11th St Unit 228
- 225 N 10th St
- 225 N 10th St
- 902 Vine St
- 2900 S Memorial Dr
- 1001 W Colonial Dr
- 3052 N Gary St Unit 116
- 3052 N Gary St Unit 115
- 3052 N Gary St Unit 121