Estimated Value: $140,904 - $171,000
About This Home
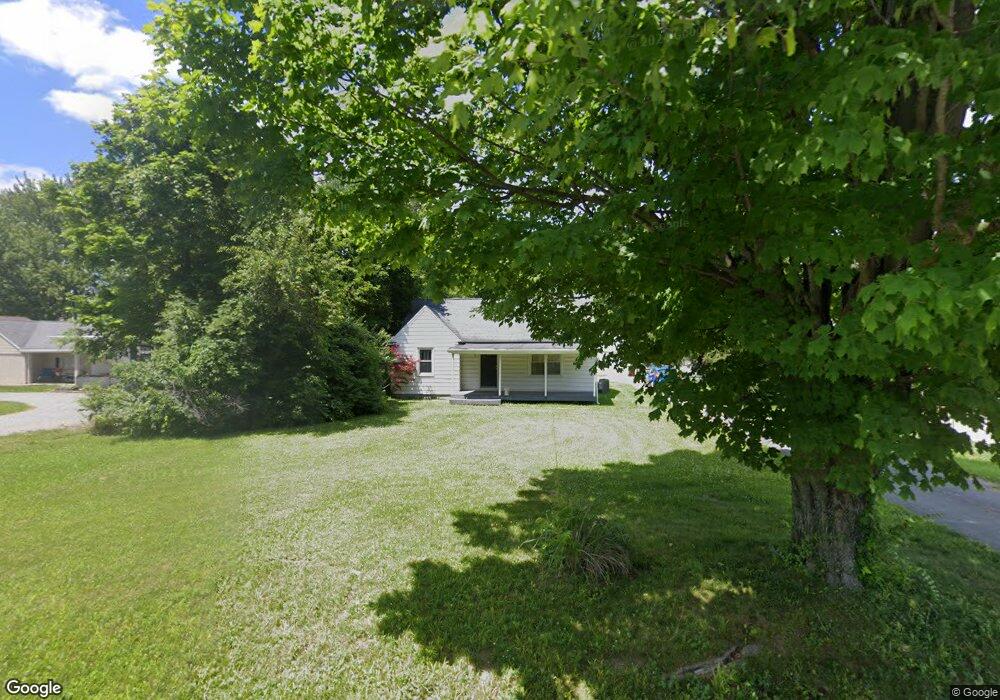
This home is located at 1223 Spruce St, Troy, OH 45373 and is currently estimated at $158,976, approximately $172 per square foot. 1223 Spruce St is a home located in Miami County with nearby schools including Heywood Elementary School, Van Cleve Elementary School, and Troy Junior High School.
Ownership History
We collect this data history from publicly available records. To have your information removed, we recommend requesting removal directly through your county’s website.
Purchase Details
Home Financials for this Owner
Home Financials are based on the most recent Mortgage that was taken out on this home.Purchase Details
Home Financials for this Owner
Home Financials are based on the most recent Mortgage that was taken out on this home.Purchase Details
Purchase Details
Home Financials for this Owner
Home Financials are based on the most recent Mortgage that was taken out on this home.Purchase Details
Purchase History
We collect this data history from publicly available records. To have your information removed, we recommend requesting removal directly through your county’s website.
| Date | Buyer | Sale Price | Title Company |
|---|---|---|---|
| $74,000 | -- | ||
| -- | -- | ||
| -- | -- | ||
| $62,500 | -- | ||
| $53,000 | -- |
Mortgage History
We collect this data history from publicly available records. To have your information removed, we recommend requesting removal directly through your county’s website.
| Date | Status | Borrower | Loan Amount |
|---|---|---|---|
| Open | $71,356 | ||
| Previous Owner | $50,350 | ||
| Previous Owner | $62,500 |
Tax History
We collect this data history from publicly available records. To have your information removed, we recommend requesting removal directly through your county’s website.
| Year | Tax Paid | Tax Assessment Tax Assessment Total Assessment is a certain percentage of the fair market value that is determined by local assessors to be the total taxable value of land and additions on the property. | Land | Improvement |
|---|---|---|---|---|
| 2025 | $1,312 | $36,750 | $7,350 | $29,400 |
| 2024 | $1,312 | $30,000 | $7,350 | $22,650 |
| 2023 | $1,168 | $30,000 | $7,350 | $22,650 |
| 2022 | $978 | $30,000 | $7,350 | $22,650 |
| 2021 | $869 | $25,000 | $6,130 | $18,870 |
| 2020 | $870 | $25,000 | $6,130 | $18,870 |
| 2019 | $878 | $25,000 | $6,130 | $18,870 |
| 2018 | $893 | $24,220 | $6,370 | $17,850 |
| 2017 | $901 | $24,220 | $6,370 | $17,850 |
| 2016 | $889 | $24,220 | $6,370 | $17,850 |
| 2015 | $888 | $23,280 | $6,130 | $17,150 |
| 2014 | $888 | $23,280 | $6,130 | $17,150 |
| 2013 | $894 | $23,280 | $6,130 | $17,150 |
Map
- 1550 Creekwood Dr
- 734 Old Newton Pike
- 1603 Old School House Rd
- 920 Old Nursery Trail
- 0 Ohio 55
- 524 W Market St
- 1443 Paul Revere Way
- 235 W Dakota St
- 1159 S Ridge Ave
- 234 W Ross St
- 1481 Lantern Ln
- 317 W Market St
- 1016 S Walnut St
- 831 S Market St
- 190 Swailes Rd
- 922 S Mulberry St
- 2151 Canterbury Ct
- 2144 Canterbury Ct
- 535 Barnhart Rd
- 624 S Clay St
Ask me questions while you tour the home.