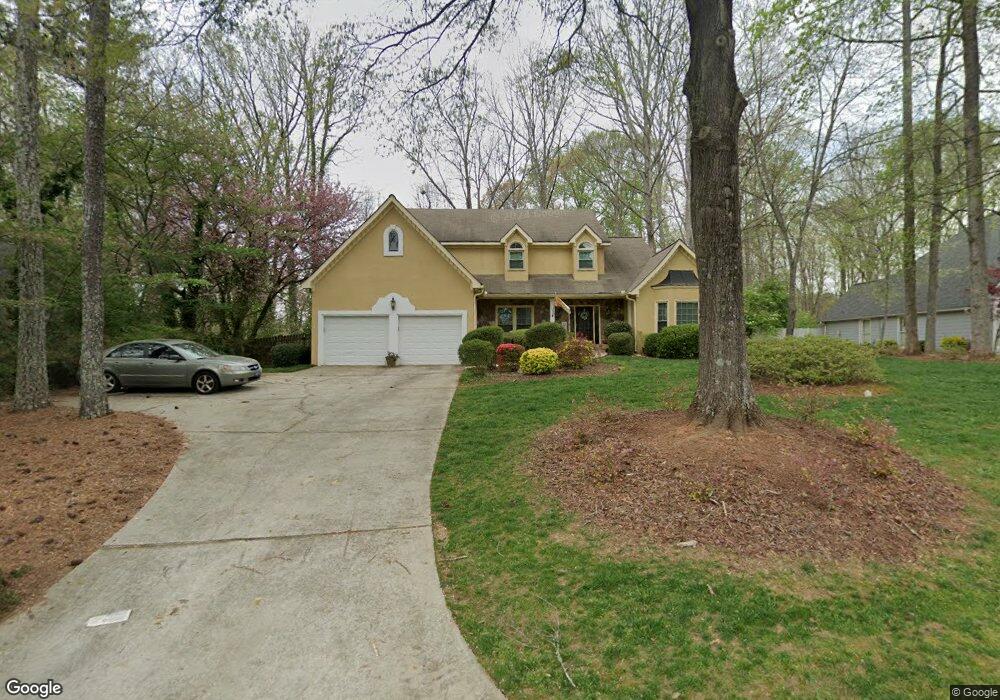
12230 Crabapple Chase Dr Unit 3 Alpharetta, GA 30004
Estimated Value: $748,806 - $849,000
4
Beds
3
Baths
2,845
Sq Ft
$276/Sq Ft
Est. Value
About This Home
This home is located at 12230 Crabapple Chase Dr Unit 3, Alpharetta, GA 30004 and is currently estimated at $784,952, approximately $275 per square foot. 12230 Crabapple Chase Dr Unit 3 is a home located in Fulton County with nearby schools including Crabapple Crossing Elementary School, Northwestern Middle School, and Milton High School.
Ownership History
Date
Name
Owned For
Owner Type
Purchase Details
Closed on
Jun 30, 1997
Sold by
Norris Christopher
Bought by
Butler Marvis R
Current Estimated Value
Home Financials for this Owner
Home Financials are based on the most recent Mortgage that was taken out on this home.
Original Mortgage
$179,550
Outstanding Balance
$26,692
Interest Rate
7.92%
Mortgage Type
New Conventional
Estimated Equity
$758,260
Purchase Details
Closed on
Apr 11, 1997
Sold by
Curtis Alex S and Curtis Margaret R
Bought by
Norris Christopher
Home Financials for this Owner
Home Financials are based on the most recent Mortgage that was taken out on this home.
Original Mortgage
$178,100
Interest Rate
9.62%
Mortgage Type
New Conventional
Purchase Details
Closed on
Nov 30, 1995
Sold by
Hurd James F
Bought by
Curtis Alex S Margaret R
Create a Home Valuation Report for This Property
The Home Valuation Report is an in-depth analysis detailing your home's value as well as a comparison with similar homes in the area
Home Values in the Area
Average Home Value in this Area
Purchase History
| Date | Buyer | Sale Price | Title Company |
|---|---|---|---|
| Butler Marvis R | $199,500 | -- | |
| Norris Christopher | $190,000 | -- | |
| Curtis Alex S Margaret R | $194,000 | -- |
Source: Public Records
Mortgage History
| Date | Status | Borrower | Loan Amount |
|---|---|---|---|
| Open | Butler Marvis R | $179,550 | |
| Previous Owner | Norris Christopher | $178,100 | |
| Closed | Curtis Alex S Margaret R | $0 |
Source: Public Records
Tax History Compared to Growth
Tax History
| Year | Tax Paid | Tax Assessment Tax Assessment Total Assessment is a certain percentage of the fair market value that is determined by local assessors to be the total taxable value of land and additions on the property. | Land | Improvement |
|---|---|---|---|---|
| 2025 | $1,402 | $255,160 | $48,760 | $206,400 |
| 2023 | $6,884 | $243,880 | $63,520 | $180,360 |
| 2022 | $5,040 | $191,560 | $40,080 | $151,480 |
| 2021 | $5,529 | $168,160 | $34,120 | $134,040 |
| 2020 | $5,573 | $166,160 | $33,720 | $132,440 |
| 2019 | $938 | $163,200 | $33,120 | $130,080 |
| 2018 | $4,024 | $142,560 | $26,800 | $115,760 |
| 2017 | $3,459 | $118,560 | $25,200 | $93,360 |
| 2016 | $3,460 | $118,560 | $25,200 | $93,360 |
| 2015 | $4,156 | $118,560 | $25,200 | $93,360 |
| 2014 | $3,634 | $118,560 | $25,200 | $93,360 |
Source: Public Records
Map
Nearby Homes
- 12250 Broadwell Rd
- 200 Welford Trace
- 755 Anna Ln
- 5065 Jonquilla Dr
- 1040 Jordan Ln
- 12440 Brookhill Crossing Ln
- 1020 Cathedral Dr
- 290 Rucker Rd
- 285 N Farm Dr
- 12455 Broadwell Rd Unit 201
- 12455 Broadwell Rd Unit 202
- 565 Camber Woods Dr
- 12474 Broadwell Rd
- 640 Mae Ln
- 530 Camber Woods Dr
- 1115 Primrose Dr
- 12575 Broadwell Rd
- 12240 Crabapple Chase Dr Unit 3
- 12220 Crabapple Chase Dr
- 610 Rucker Rd
- 12250 Crabapple Chase Dr
- 12225 Crabapple Chase Dr
- 12235 Crabapple Chase Dr
- 12245 Crabapple Chase Dr
- 105 Welford Trace
- 12260 Crabapple Chase Dr Unit 3
- 12255 Crabapple Chase Dr
- 115 Welford Trace
- 12263 Ferncreek Dr
- 100 Welford Trace
- 12270 Crabapple Chase Dr
- 12265 Ferncreek Dr
- 12265 Crabapple Chase Dr
- 125 Welford Trace
- 110 Welford Trace
- 12261 Ferncreek Dr
- 12275 Crabapple Chase Dr Unit 3