12231 SE 59th St Unit 89 Bellevue, WA 98006
Newport NeighborhoodEstimated Value: $291,000 - $336,000
1
Bed
1
Bath
663
Sq Ft
$473/Sq Ft
Est. Value
About This Home
This home is located at 12231 SE 59th St Unit 89, Bellevue, WA 98006 and is currently estimated at $313,835, approximately $473 per square foot. 12231 SE 59th St Unit 89 is a home located in King County with nearby schools including Newport Heights Elementary School, Tyee Middle School, and Newport High School.
Ownership History
Date
Name
Owned For
Owner Type
Purchase Details
Closed on
Feb 23, 2011
Sold by
Fannie Mae
Bought by
Lu Yuanmeng and Zhang Si Jian
Current Estimated Value
Purchase Details
Closed on
Jan 6, 2011
Sold by
Kirkpatrick Kelvin B and Kirkpatrick Christina L
Bought by
Federal National Mortgage Association
Purchase Details
Closed on
Dec 11, 2007
Sold by
Eaton Golder Michelle M and Golder Anthony J
Bought by
Kirkpatrick Kelvin B and Kirkpatrick Christina L
Home Financials for this Owner
Home Financials are based on the most recent Mortgage that was taken out on this home.
Original Mortgage
$149,242
Interest Rate
6.15%
Purchase Details
Closed on
Jun 20, 1996
Sold by
Campbell James O and Campbell Margaret
Bought by
Eaton Michelle M
Home Financials for this Owner
Home Financials are based on the most recent Mortgage that was taken out on this home.
Original Mortgage
$49,850
Interest Rate
8.09%
Mortgage Type
FHA
Create a Home Valuation Report for This Property
The Home Valuation Report is an in-depth analysis detailing your home's value as well as a comparison with similar homes in the area
Home Values in the Area
Average Home Value in this Area
Purchase History
| Date | Buyer | Sale Price | Title Company |
|---|---|---|---|
| Lu Yuanmeng | $96,888 | Chicago Title | |
| Federal National Mortgage Association | $167,921 | None Available | |
| Kirkpatrick Kelvin B | $186,553 | The Talon Grou | |
| Eaton Michelle M | $51,000 | Chicago Title Insurance Co |
Source: Public Records
Mortgage History
| Date | Status | Borrower | Loan Amount |
|---|---|---|---|
| Previous Owner | Kirkpatrick Kelvin B | $149,242 | |
| Previous Owner | Eaton Michelle M | $49,850 |
Source: Public Records
Tax History Compared to Growth
Tax History
| Year | Tax Paid | Tax Assessment Tax Assessment Total Assessment is a certain percentage of the fair market value that is determined by local assessors to be the total taxable value of land and additions on the property. | Land | Improvement |
|---|---|---|---|---|
| 2024 | $2,344 | $305,000 | $87,800 | $217,200 |
| 2023 | $2,325 | $334,000 | $87,800 | $246,200 |
| 2022 | $2,439 | $313,000 | $87,800 | $225,200 |
| 2021 | $2,399 | $283,000 | $87,800 | $195,200 |
| 2020 | $2,339 | $258,000 | $87,800 | $170,200 |
| 2018 | $1,779 | $219,000 | $87,800 | $131,200 |
| 2017 | $1,451 | $183,000 | $83,700 | $99,300 |
| 2016 | $1,377 | $156,000 | $39,400 | $116,600 |
| 2015 | $1,287 | $147,000 | $42,900 | $104,100 |
| 2014 | -- | $136,000 | $23,700 | $112,300 |
| 2013 | -- | $107,000 | $20,500 | $86,500 |
Source: Public Records
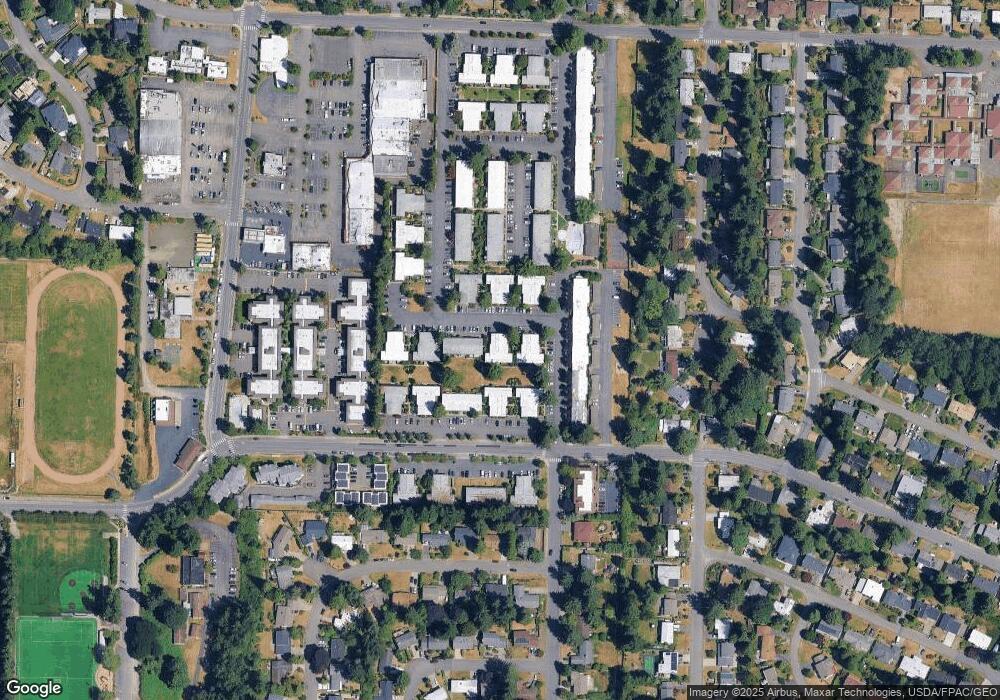
Map
Nearby Homes
- 12240 SE 60th St Unit 41
- 5722 122nd Place SE Unit 235
- 5628 123rd Ave SE
- 12025 SE 60th St Unit B
- 6202 122nd Ave SE
- 12502 SE 62nd Place
- 6225 122nd Ave SE
- 12554 SE 52nd St
- 11715 SE 64th St
- 0 xx SE 66th St
- 6129 115th Place SE
- 5227 116th Place SE
- 5015 123rd Ave SE
- 12518 SE 67th St
- 4961 120th Ave SE
- 6608 117th Ave SE
- 11250 SE 60th St
- 11220 SE 64th St
- 13206 SE 51st Place
- 7015 123rd Ave SE
- 12231 SE 59th St Unit 87
- 12231 SE 59th St Unit 81
- 12231 SE 59th St Unit 88
- 12231 SE 59th St Unit 84
- 12231 SE 59th St Unit X86
- 12231 SE 59th St
- 12231 SE 59th St Unit 82
- 12211 SE 59th St Unit 62
- 12211 SE 59th St Unit 65
- 12211 SE 59th St Unit 64
- 12211 SE 59th St
- 12211 SE 59th St Unit 61
- 12211 SE 59th St Unit 66
- 12221 SE 59th St Unit 71
- 12221 SE 59th St Unit 75
- 12221 SE 59th St Unit 72
- 12241 SE 59th St Unit 92
- 12241 SE 59th St Unit 96
- 12241 SE 59th St Unit 94
- 12241 SE 59th St Unit 95