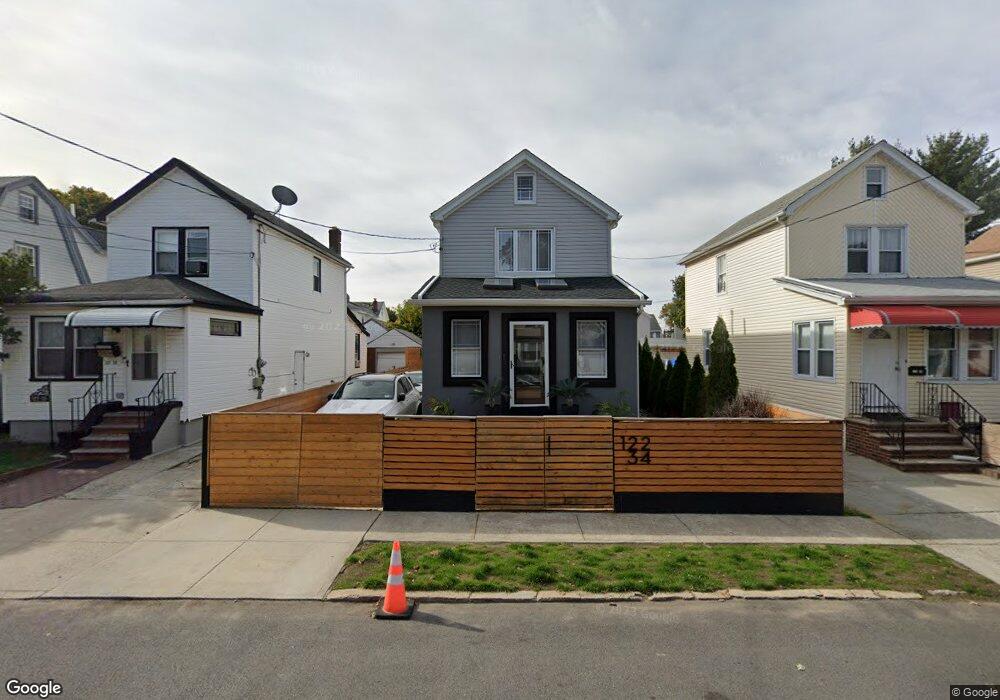
12234 Grayson St Springfield Gardens, NY 11413
Saint Albans NeighborhoodEstimated Value: $612,000 - $782,000
2
Beds
2
Baths
1,438
Sq Ft
$481/Sq Ft
Est. Value
About This Home
This home is located at 12234 Grayson St, Springfield Gardens, NY 11413 and is currently estimated at $692,156, approximately $481 per square foot. 12234 Grayson St is a home located in Queens County with nearby schools including P.S. 15 Jackie Robinson, Is 59 Springfield Gardens, and Success Academy Springfield Gardens.
Ownership History
Date
Name
Owned For
Owner Type
Purchase Details
Closed on
Jun 16, 2016
Sold by
Jones Cory and Jones Toni
Bought by
Torres Victor
Current Estimated Value
Home Financials for this Owner
Home Financials are based on the most recent Mortgage that was taken out on this home.
Original Mortgage
$405,535
Outstanding Balance
$321,884
Interest Rate
3.57%
Mortgage Type
New Conventional
Estimated Equity
$370,272
Purchase Details
Closed on
Sep 3, 2008
Sold by
Shaw Tina
Bought by
Jones Cory and Jones Toni
Home Financials for this Owner
Home Financials are based on the most recent Mortgage that was taken out on this home.
Original Mortgage
$269,150
Interest Rate
6.54%
Mortgage Type
Purchase Money Mortgage
Purchase Details
Closed on
Feb 1, 2008
Sold by
Pereira Frank
Bought by
Shaw Tina
Create a Home Valuation Report for This Property
The Home Valuation Report is an in-depth analysis detailing your home's value as well as a comparison with similar homes in the area
Home Values in the Area
Average Home Value in this Area
Purchase History
| Date | Buyer | Sale Price | Title Company |
|---|---|---|---|
| Torres Victor | $397,000 | -- | |
| Jones Cory | $270,000 | -- | |
| Jones Cory | $270,000 | -- | |
| Shaw Tina | -- | -- | |
| Shaw Tina | -- | -- |
Source: Public Records
Mortgage History
| Date | Status | Borrower | Loan Amount |
|---|---|---|---|
| Open | Torres Victor | $405,535 | |
| Previous Owner | Jones Cory | $269,150 |
Source: Public Records
Tax History Compared to Growth
Tax History
| Year | Tax Paid | Tax Assessment Tax Assessment Total Assessment is a certain percentage of the fair market value that is determined by local assessors to be the total taxable value of land and additions on the property. | Land | Improvement |
|---|---|---|---|---|
| 2025 | $3,597 | $24,074 | $6,009 | $18,065 |
| 2024 | $3,597 | $22,711 | $6,792 | $15,919 |
| 2023 | $3,340 | $21,427 | $5,616 | $15,811 |
| 2022 | $3,319 | $29,940 | $9,420 | $20,520 |
| 2021 | $3,465 | $24,840 | $9,420 | $15,420 |
| 2020 | $3,231 | $24,420 | $9,420 | $15,000 |
| 2019 | $2,969 | $24,240 | $9,420 | $14,820 |
| 2018 | $2,730 | $17,856 | $6,581 | $11,275 |
| 2017 | $3,260 | $17,856 | $7,244 | $10,612 |
| 2016 | $3,543 | $17,856 | $7,244 | $10,612 |
| 2015 | $2,040 | $16,718 | $8,125 | $8,593 |
| 2014 | $2,040 | $15,772 | $9,209 | $6,563 |
Source: Public Records
Map
Nearby Homes
- 12253 Milburn St
- 12251 Grayson St
- 12244 Nellis St
- 12248 Benton St
- 122-22 Nellis St
- 122-66 Nellis St
- 18806 Nashville Blvd
- 12133 Grayson St
- 187-16 Williamson Ave
- 19009 122nd Ave
- 187-04 Williamson Ave
- 191-01 122nd Ave
- 17915 Eveleth Rd
- 179-47 Zoller Rd
- 17911 Eveleth Rd
- 19115 Williamson Ave
- 12811 Harry Douglass Way
- 12512 Nepton St
- 179-50 Anderson Rd
- 17836 Eveleth Rd
- 12234 Grayson St
- 122-38 Grayson St
- 122-30 Grayson St
- 12230 Grayson St
- 12238 Grayson St
- 122-42 Grayson St
- 12226 Grayson St
- 12242 Grayson St
- 12222 Grayson St
- 12244 Grayson St
- 12229 Grayson St
- 12233 Grayson St
- 12229 Grayson St
- 12235 Grayson St
- 12239 Milburn St
- 12235 Milburn St
- 12243 Milburn St
- 122-20 Grayson St
- 12220 Grayson St
- 12239 Milburn St