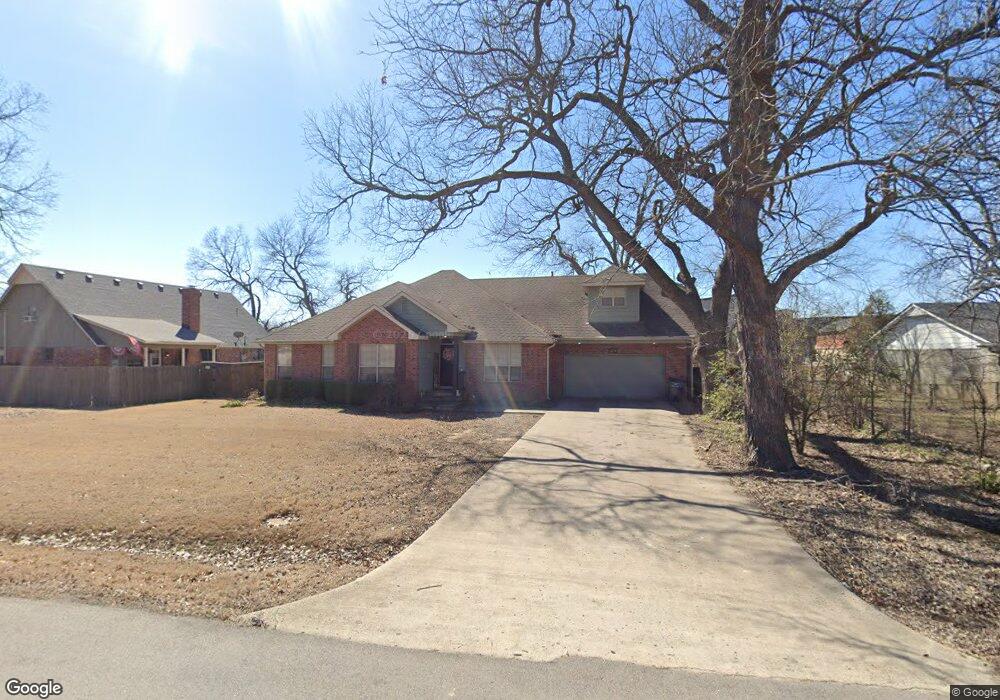
12234 S 85th East Ave Bixby, OK 74008
North Bixby NeighborhoodEstimated Value: $389,256 - $466,000
4
Beds
3
Baths
2,677
Sq Ft
$156/Sq Ft
Est. Value
About This Home
This home is located at 12234 S 85th East Ave, Bixby, OK 74008 and is currently estimated at $417,814, approximately $156 per square foot. 12234 S 85th East Ave is a home located in Tulsa County with nearby schools including Bixby North Elementary, Bixby North Intermediate, and Bixby Middle School.
Ownership History
Date
Name
Owned For
Owner Type
Purchase Details
Closed on
Nov 17, 2015
Sold by
King Thelma D
Bought by
King Brent M
Current Estimated Value
Home Financials for this Owner
Home Financials are based on the most recent Mortgage that was taken out on this home.
Original Mortgage
$211,029
Outstanding Balance
$166,602
Interest Rate
3.9%
Mortgage Type
FHA
Estimated Equity
$251,212
Purchase Details
Closed on
Apr 13, 2006
Sold by
Vintage Built Homes Llc
Bought by
King Brent M and King Thelma D
Home Financials for this Owner
Home Financials are based on the most recent Mortgage that was taken out on this home.
Original Mortgage
$168,720
Interest Rate
6.22%
Mortgage Type
Fannie Mae Freddie Mac
Purchase Details
Closed on
Jul 18, 2005
Sold by
Skidmore Michael A and Skidmore Julie A
Bought by
Vintage Built Homes Llc
Home Financials for this Owner
Home Financials are based on the most recent Mortgage that was taken out on this home.
Original Mortgage
$113,400
Interest Rate
5.64%
Mortgage Type
Construction
Create a Home Valuation Report for This Property
The Home Valuation Report is an in-depth analysis detailing your home's value as well as a comparison with similar homes in the area
Home Values in the Area
Average Home Value in this Area
Purchase History
| Date | Buyer | Sale Price | Title Company |
|---|---|---|---|
| King Brent M | -- | -- | |
| King Brent M | $211,000 | None Available | |
| Vintage Built Homes Llc | $21,500 | -- |
Source: Public Records
Mortgage History
| Date | Status | Borrower | Loan Amount |
|---|---|---|---|
| Open | King Brent M | $211,029 | |
| Previous Owner | King Brent M | $168,720 | |
| Previous Owner | Vintage Built Homes Llc | $113,400 |
Source: Public Records
Tax History Compared to Growth
Tax History
| Year | Tax Paid | Tax Assessment Tax Assessment Total Assessment is a certain percentage of the fair market value that is determined by local assessors to be the total taxable value of land and additions on the property. | Land | Improvement |
|---|---|---|---|---|
| 2024 | $3,615 | $26,645 | $2,049 | $24,596 |
| 2023 | $3,615 | $26,839 | $2,043 | $24,796 |
| 2022 | $3,521 | $25,058 | $2,553 | $22,505 |
| 2021 | $3,191 | $24,299 | $2,476 | $21,823 |
| 2020 | $3,211 | $24,299 | $2,476 | $21,823 |
| 2019 | $3,224 | $24,299 | $2,476 | $21,823 |
| 2018 | $3,194 | $24,299 | $2,476 | $21,823 |
| 2017 | $3,173 | $25,299 | $2,578 | $22,721 |
| 2016 | $3,109 | $25,102 | $2,578 | $22,721 |
| 2015 | $3,007 | $25,299 | $2,578 | $22,721 |
| 2014 | $2,859 | $23,210 | $2,365 | $20,845 |
Source: Public Records
Map
Nearby Homes
- 8508 E 123rd St S
- 8512 E 121st St S
- 8118 E 124th St S
- 8812 E 121st St S
- 8431 E 126th St S
- 12300 S Memorial Dr
- 11850 S 87th East Ave
- 8712 E 126th St S
- 8645 E 126th Place S
- 8725 E 126th Place S
- 11946 S 90th East Ave
- 12451 S 75th Ave E
- 7700 E 118th St S
- 7362 E 119th Place S
- 12545 S 73rd East Place
- 7362 E 119th St S
- 12659 S 73rd Place E
- 9041 E 117th St S
- 9613 E 119th Ct S
- 000 S Mingo Rd E
- 12230 S 85th East Ave
- 8400 E 123rd St S
- 12202 S 85th East Ave
- 12235 S 85th East Ave
- 12233 S 85th East Ave
- 5910 E 128th St S
- 5919 E 128th St S
- 5419 E 125th Place S
- 5419 E 125th Place S
- 8420 E 123rd St S
- 12108 S 85th East Ave
- 8504 E 122nd St S
- 7508 E 158th St S
- 7407 E 157th Place S
- 7520 E 158th St S
- 7547 E 158th St S
- 7533 E 157th Place S
- 7508 E 157th Place S
- 15752 S 74th East Ave