Estimated Value: $268,000 - $290,000
--
Bed
2
Baths
1,709
Sq Ft
$163/Sq Ft
Est. Value
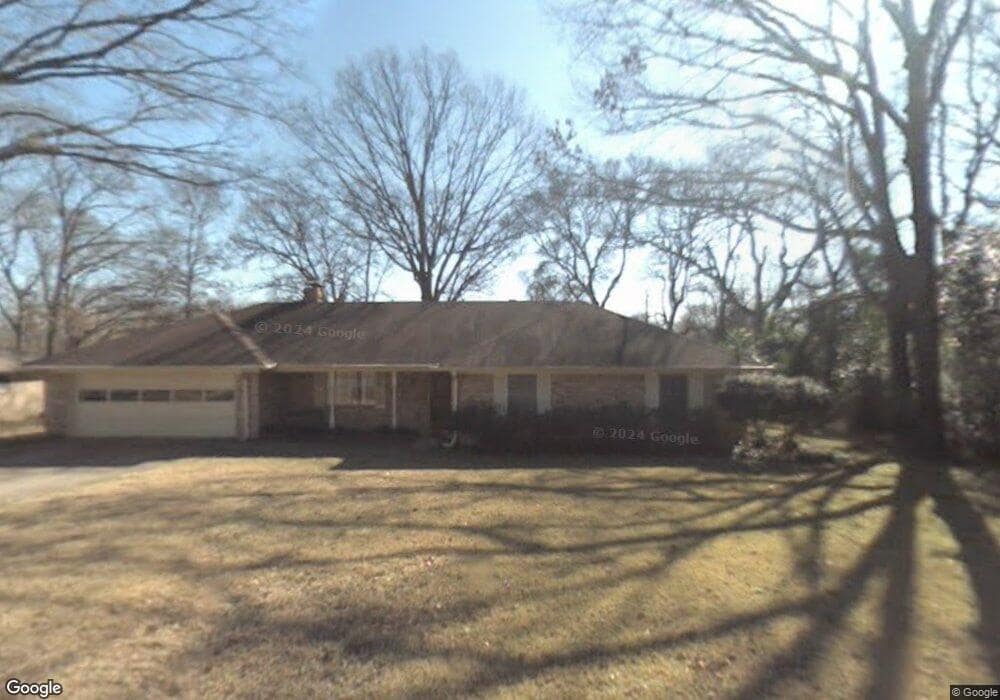
About This Home
This home is located at 1224 1224 Kingsbury, Tyler, TX 75701 and is currently estimated at $279,321, approximately $163 per square foot. 1224 1224 Kingsbury is a home located in Smith County with nearby schools including Woods Elementary School, Hubbard Middle School, and Tyler Legacy High School.
Ownership History
Date
Name
Owned For
Owner Type
Purchase Details
Closed on
May 12, 2022
Sold by
Ann Knight Margaret
Bought by
Mcneel Tynus W and Mcneel Laura A
Current Estimated Value
Home Financials for this Owner
Home Financials are based on the most recent Mortgage that was taken out on this home.
Original Mortgage
$260,000
Outstanding Balance
$246,398
Interest Rate
5.3%
Mortgage Type
VA
Estimated Equity
$32,923
Purchase Details
Closed on
Jul 15, 2015
Sold by
Bonner Benjamin T and Bonner Lindsey
Bought by
Knight Margaret Ann
Purchase Details
Closed on
Jun 30, 2011
Sold by
Weaver Darren R and Weaver Melody
Bought by
Bonner Benjamin T
Home Financials for this Owner
Home Financials are based on the most recent Mortgage that was taken out on this home.
Original Mortgage
$140,836
Interest Rate
4.37%
Mortgage Type
FHA
Create a Home Valuation Report for This Property
The Home Valuation Report is an in-depth analysis detailing your home's value as well as a comparison with similar homes in the area
Home Values in the Area
Average Home Value in this Area
Purchase History
| Date | Buyer | Sale Price | Title Company |
|---|---|---|---|
| Mcneel Tynus W | -- | Casey H Cross | |
| Knight Margaret Ann | -- | East Texas Title Co | |
| Bonner Benjamin T | -- | None Available |
Source: Public Records
Mortgage History
| Date | Status | Borrower | Loan Amount |
|---|---|---|---|
| Open | Mcneel Tynus W | $260,000 | |
| Previous Owner | Bonner Benjamin T | $140,836 |
Source: Public Records
Tax History Compared to Growth
Tax History
| Year | Tax Paid | Tax Assessment Tax Assessment Total Assessment is a certain percentage of the fair market value that is determined by local assessors to be the total taxable value of land and additions on the property. | Land | Improvement |
|---|---|---|---|---|
| 2025 | $4,250 | $303,703 | $97,192 | $206,511 |
| 2024 | $4,250 | $249,845 | $40,135 | $209,710 |
| 2023 | $4,205 | $241,249 | $40,135 | $201,114 |
| 2022 | $4,527 | $231,065 | $40,135 | $190,930 |
| 2021 | $3,678 | $175,307 | $22,934 | $152,373 |
| 2020 | $3,566 | $166,665 | $16,324 | $150,341 |
| 2019 | $3,404 | $155,649 | $16,324 | $139,325 |
| 2018 | $3,220 | $148,055 | $16,324 | $131,731 |
| 2017 | $3,161 | $148,055 | $16,324 | $131,731 |
| 2016 | $2,944 | $137,899 | $16,324 | $121,575 |
| 2015 | $2,742 | $132,998 | $16,324 | $116,674 |
| 2014 | $2,742 | $129,017 | $16,324 | $112,693 |
Source: Public Records
Map
Nearby Homes
- 3518 Cloverdale Dr
- 3505 Cloverdale Dr
- 3829 Cloverdale Dr
- 1317 Woodland Hills Dr
- 3501 Silverwood Dr
- 3500 Silverwood Dr
- 3606 Glendale Dr
- 3425 Iberville Dr
- 3915 Post Oak Rd
- 3426 Bienville Dr
- 815 Woodland Hills Dr
- 3413 Iberville Dr
- 3404 Silverwood Dr
- 4001 Darrell Ln
- 1531 Woodland Hills Dr
- 3903 Appletree Ln
- 701 Woodland Hills Dr
- 612 Rosemont Place II
- 3324 Teakwood Dr
- 604-606 Woodland Hills Dr
- 1224 Kingsbury Dr
- 1218 Kingsbury Dr
- 1223 Woodland Hills Dr
- 1225 Kingsbury Dr
- 1219 Kingsbury Dr
- 1217 Woodland Hills Dr
- 1212 Kingsbury Dr
- 1301 Woodland Hills Dr
- 1213 1213 Kingsbury
- 1213 Kingsbury Dr
- 1211 Woodland Hills Dr
- 1224 Hampton Ln
- 1206 Kingsbury Dr
- 1218 Hampton Ln
- 1207 Kingsbury Dr
- 1307 Woodland Hills Dr
- 1222 1222 Woodland Hills
- 1212 Hampton Ln
- 1218 Woodland Hills Dr
- 1205 Woodland Hills Dr