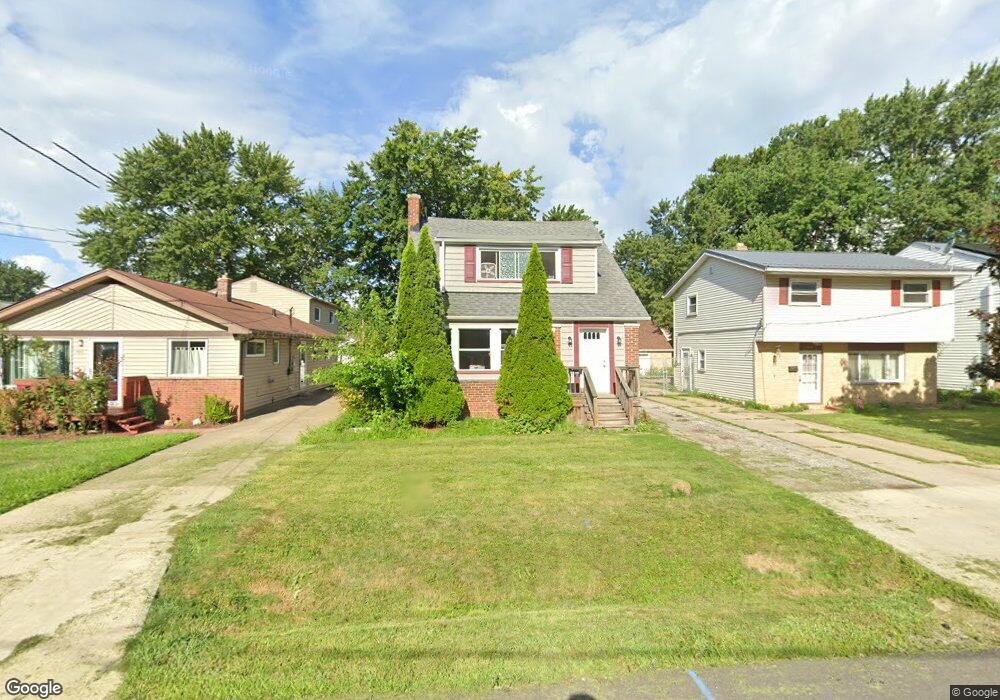
1224 E 348th St Eastlake, OH 44095
Estimated Value: $180,000 - $225,000
3
Beds
3
Baths
1,632
Sq Ft
$125/Sq Ft
Est. Value
About This Home
This home is located at 1224 E 348th St, Eastlake, OH 44095 and is currently estimated at $203,694, approximately $124 per square foot. 1224 E 348th St is a home located in Lake County with nearby schools including Longfellow Elementary School, Eastlake Middle School, and North High School.
Ownership History
Date
Name
Owned For
Owner Type
Purchase Details
Closed on
Jan 3, 2013
Sold by
Father & Son Investment Holdings Llc
Bought by
Scaperato Michael
Current Estimated Value
Purchase Details
Closed on
Jan 21, 2011
Sold by
Scaperato Michael J and Scaperato Marylynn
Bought by
Father & Son Investment Holdings Llc
Purchase Details
Closed on
May 29, 2009
Sold by
Christiana Bank & Trust Company
Bought by
Scaperato Michael J
Purchase Details
Closed on
Nov 7, 2008
Sold by
Price Pamela M
Bought by
Christiana Bank & Trust Company
Purchase Details
Closed on
Sep 25, 1999
Sold by
Mallon Patrick J and Mallon Susan M
Bought by
Price Keith A and Price Pamela M
Home Financials for this Owner
Home Financials are based on the most recent Mortgage that was taken out on this home.
Original Mortgage
$90,000
Interest Rate
9.5%
Purchase Details
Closed on
Feb 24, 1992
Bought by
Mallon Patrick J
Create a Home Valuation Report for This Property
The Home Valuation Report is an in-depth analysis detailing your home's value as well as a comparison with similar homes in the area
Home Values in the Area
Average Home Value in this Area
Purchase History
| Date | Buyer | Sale Price | Title Company |
|---|---|---|---|
| Scaperato Michael | -- | None Available | |
| Father & Son Investment Holdings Llc | -- | Attorney | |
| Scaperato Michael J | $31,000 | Attorney | |
| Christiana Bank & Trust Company | $78,000 | None Available | |
| Price Keith A | $90,000 | Americas Choice Title Agency | |
| Mallon Patrick J | $78,000 | -- |
Source: Public Records
Mortgage History
| Date | Status | Borrower | Loan Amount |
|---|---|---|---|
| Previous Owner | Price Keith A | $90,000 |
Source: Public Records
Tax History Compared to Growth
Tax History
| Year | Tax Paid | Tax Assessment Tax Assessment Total Assessment is a certain percentage of the fair market value that is determined by local assessors to be the total taxable value of land and additions on the property. | Land | Improvement |
|---|---|---|---|---|
| 2024 | -- | $73,400 | $9,260 | $64,140 |
| 2023 | $5,450 | $56,390 | $7,960 | $48,430 |
| 2022 | $3,691 | $56,390 | $7,960 | $48,430 |
| 2021 | $3,708 | $56,390 | $7,960 | $48,430 |
| 2020 | $3,339 | $45,100 | $6,360 | $38,740 |
| 2019 | $3,113 | $45,100 | $6,360 | $38,740 |
| 2018 | $3,074 | $35,580 | $10,890 | $24,690 |
| 2017 | $2,585 | $35,580 | $10,890 | $24,690 |
| 2016 | $2,420 | $35,580 | $10,890 | $24,690 |
| 2015 | $2,370 | $35,580 | $10,890 | $24,690 |
| 2014 | $2,251 | $35,580 | $10,890 | $24,690 |
| 2013 | $2,252 | $35,580 | $10,890 | $24,690 |
Source: Public Records
Map
Nearby Homes
- 1224 E 351st St
- 1280 E 351st St
- 1268 E 343rd St
- 1041 E 349th St
- 1271 Hulett Ave
- 1238 Hulett Ave
- 988 E 348th St
- 35821 Meyer Ave
- 1263 Jakse Dr
- 1316 E 359th St
- 1222 E 360th St
- 918 E 349th St
- 33256 Willowick Dr
- 1238 E 362nd St
- 1270 E 362nd St
- 34633 Glen Dr
- 3780 E 364th St
- 34622 Iris Ln
- 1511 E 337th St
- 34682 Iris Ln
- 1218 E 348th St
- 1228 E 348th St
- 1212 E 348th St
- 1232 E 348th St
- 1238 E 348th St
- 1227 E 346th St
- 1223 E 346th St
- 1231 E 346th St
- 1208 E 348th St
- 1217 E 346th St
- 1235 E 346th St
- 1223 E 348th St
- 1244 E 348th St
- 1241 E 346th St
- 1227 E 348th St
- 1215 E 348th St
- 1231 E 348th St
- 1211 E 346th St
- 1245 E 346th St
- 1205 E 348th St